
 Search
WHAT IS THE MJO REALLY?
Page 1 of 1

WHAT IS THE MJO REALLY?
![]() by sroc4 Sun Mar 08, 2015 9:27 am
by sroc4 Sun Mar 08, 2015 9:27 am
SoulSingMG wrote:algae888 wrote:wow look at the model agreement with the mjo. gfs is off the charts .
Okay. If anyone has the time, would you mind explaining this chart in layman's terms to those of us who are less versed? Thanks a ton in advance -- stuff is so fascinating.

The Madden-Julian Oscillation (MJO) is the major fluctuation in tropical weather on weekly to monthly timescales. The MJO can be characterised as an eastward moving 'pulse' of cloud and rainfall(Convection) near the equator that typically recurs every 30 to 60 days.
The MJO phase diagram illustrates the progression of the MJO through different phases, which generally coincide with locations along the equator around the globe. RMM1 and RMM2 are mathematical methods that combine cloud amount and winds at upper and lower levels of the atmosphere to provide a measure of the strength and location of the MJO. When the index is within the centre circle the MJO is considered weak, meaning it is difficult to discern using the RMM methods. Outside of this circle the index is stronger and will usually move in an anti-clockwise direction as the MJO moves from west to east. For convenience, we define 8 different MJO phases in this diagram.
Here is the last 40days of the actual MJO leading up through March 5th. (NOTE: The MJO graph posted is actually updated continuously to the real time and not from when this write up was originally posted) What Al posted above is the forecast for the MJO for all the various models that forecast it going forward.
The further away from the inner circle typically means the stronger the pulse of convection over a specific area from the Tropical Pac to the Indian Ocean. A given location around these areas correlates with a particular phase. The image below gives you an idea of where phases 1-8 occur within the rectangle. Don't worry about the other stuff on that picture. The link for that image is provided below. The rising motion in the various phases, and subsequent energy associated with this often feeds this energy into the jet streams enhancing them leading to enhancement in the amplitudes of the troughs and ridges. For instance when the MJO is pulsing in phase 8 enhanced convection can be seen around the date line in the central Pacific. This will typically increase our chances for an EC storm because it feeds into and can enhance the sub Aleution trough which leads to west coast ridge which leads to east coast trough.


Here are some links for additional reading on the MJO and where I got most of this info. Hope this helps.
http://www.regional.org.au/au/asa/2004/poster/2/6/1362_donalda.htm
https://www2.ucar.edu/atmosnews/news/5420/scientists-probe-indian-ocean-clues-worldwide-weather-patterns
https://www2.ucar.edu/news/backgrounders/weather-maker-glossary#mno
http://www.bom.gov.au/climate/mjo/ (Histrorical MJO site...very useful)
http://www.cpc.ncep.noaa.gov/products/precip/CWlink/MJO/Composites/Temperature/
http://www.cpc.ncep.noaa.gov/products/precip/CWlink/MJO/Composites/Precipitation/
Last edited by sroc4 on Fri Nov 03, 2017 9:45 am; edited 3 times in total
_________________
"In weather and in life, there's no winning and losing; there's only winning and learning."
WINTER 2012/2013 TOTALS 43.65"WINTER 2017/2018 TOTALS 62.85" WINTER 2022/2023 TOTALS 4.9"
WINTER 2013/2014 TOTALS 64.85"WINTER 2018/2019 TOTALS 14.25" WINTER 2023/2024 TOTALS 13.1"
WINTER 2014/2015 TOTALS 71.20"WINTER 2019/2020 TOTALS 6.35"
WINTER 2015/2016 TOTALS 35.00"WINTER 2020/2021 TOTALS 37.75"
WINTER 2016/2017 TOTALS 42.25"WINTER 2021/2022 TOTALS 31.65"

sroc4- Admin

- Posts : 8331
Reputation : 301
Join date : 2013-01-07
Location : Wading River, LI
Re: WHAT IS THE MJO REALLY?
![]() by sroc4 Sun Mar 08, 2015 9:27 am
by sroc4 Sun Mar 08, 2015 9:27 am
Im still learning too Doc. In fact the entire scientific community is still trying to understand better the true MJO influences. I have a client who works for Brookhaven Natnl Lab who is currently doing research on the "atmospheric rivers". Right now he is on assignment out in Cali somewhere doing research. Every time he comes in I pick his brain. Atmospheric Rivers are relatively narrow regions in the atmosphere that are responsible for most of the horizontal transport of water vapor outside of the tropics. The MJO pulses are a part of this phenomenon.
So here is a little more info to help drive home the point of how the MJO relates to our weather and its influences on a broad scale to the weather pattern. Below is the Euro MJO forecast going forward. Notice two things. 1) You can see the MJO has exited the circle of death(COD), as its called, and into its current position in phase 5 close to phase 4. What this means is if we look at a satellite we should see a broad region of convection (rising air leading to cloud cover with rain and thunderstorms) over the geographical region that correlates with phase 5. and 2) at the end of the forecast it looks to be strongly into phase 7 then 8(we will get to this point again further down)

 " />
" />
Now lets quickly revisit the map with the phases and their geographic location for now pay particular attention to where phase 4 and 5 are:
 " />
" />
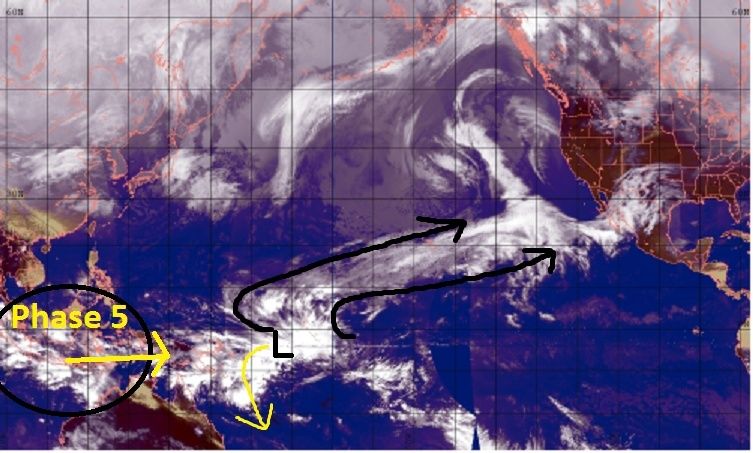
Now look at this current sat image. In the circle in the bottom left corner you will notice there is exactly that, a broad area of disorganized convection. This is a pulse of the MJO in the phase 5 region(bordering the phase 4 region) of the graphics above.
 " />
" />
If you recall in the write up I had from last night, once you get a pulse from the MJO, regardless of the phase (meaning the disorganized pulse of convection), it will propagate east and last on avg for typically 4-10days per phase. Sometimes propagating quicker sometimes slower, and sometimes dissipating along the way, aka crashing back into the COD. One other thing I want to point out on the Sat image above. Notice the LP I have drawn in. This is a tropical wave that is propagating west and eventually the LP will get organized and will eventually recurve south of the Equator and become a very powerful tropical cyclone for the southern hemisphere, but you can see how the convection, aka energy, from this tropical wave is actually feeding into the trough feature south of the Gulf of Alaska(GOA) as well as enhancing the STJ headed into Mexico's west coast. Behold an "atmospheric river" before your very eye.
Ok, still with me? Now lets focus on point two made above. Go back to the first graphic showing the Euro's MJO forecast. Let me explain one last thing about that graphic. All the yellow lines you see are all the individual runs by that model just like the ensembles we look at for surfaces etc. The Green line running through the middle is the mean of all those runs, and each sm black dot represents 24 hrs from the last dot. If you follow the black dots you will notice that in about 2-3 days the MJO pulse should propagate through the rest of phase 5 and into phase 6. In another 2-3 days it will continue propagating east into phases 7, and eventually in about 9-12days from now try and move into phase 8. Now remember using the sat image above starting in the current phase 5 visualize this wave of convection moving east ward through the phases.
Ok so how will this phase 7 and 8 possibly give up one last winter bang!? Some very smart people who have been studying the MJO over the past decade or so have recognized a statistical correlation between the phase of the MJO and the mean surface low pressure(MSLP) within certain regions of the globe. Lets look at phase 7 and 8. Below is a graphic that shows that when the MJO is in phases 7 and 8 that the MSLP in the region to the south of the Aleutian Islands has a lower anomaly(seen as blue colors)(Note: the red colors are higher pressure anomalies which typically indicates ridging). This means there is most likely going to be a trough there. As we should already know, or maybe your learning for the first time, a trough positioned in this area leads to a ridge along the west coast of North America. This ridge is broken up into two regions, the EPO and the PNA. A -EPO = ridge from W Canada up into Alaska, and a +PNA = ridge over western CONUS into W Canada. This ridge in turn then leads to a trough in the eastern third of the country. In phase 8 you can see there is a higher tendency for LP to develop off the EC as well.
 " />
" />
So this leads to my take home point here. Since the MJO pulse looks to be very strong phase 7 and 8 in all likelihood the Aleution trough will be potent amplifying the ridge and trough down stream proportionally. The conditions for this ridging complex are still ideal when looking at the SST off the NA coast as they have been since last Jan. Just like the sat image above if this MJO forecast holds you will see a similar "atmospheric river" or strong tropical moisture transport feeding the Sub Aleutian trough and STJ into Mexico originating in the geographical location that correlates with those particular phases The energy from here in part will lead to short waves riding up over the ridging in the west and diving into the conus via the northern jet stream. In addition it will enhance an already active STJ. So if the timing is right between the 19th-24th or so we could get the northern and southern branches phase energies and boom! you get what yesterdays 00z GFS showed, a fully phased EC beast.
Look this is all potential. I have shown you how the MJO could lead to a very favorable upper level pattern for an EC storm to develop between the 19th and 24th. HOWEVER; 1) It doesn't mean the ingredients come together right and 2) the upper level forecast can still change this far out. So for now we sit back because we still have to get through the next week of a more relaxed pattern as the MJO moves through phases 5 and 6 over the next week or so. The last graphic shows the MSLP anomalies and their relation to MJO phases 5 and 6. Notice the reds south of the Aleutian Islands as well as along the EC which typically leads to more ridging in these locals which typically leads to a slightly warmer (relative to the past month or two) and dryer pattern in the northeast.
 " />
" />
I will leave you with one final point about the influences of the MJO. The influences we see on our weather in the various phases is not the same during different times of the year. IE: a phase 7 or 8 in the winter leads to an entirely different upper level pattern when compared to a phase 7 or 8 in the summer. The details of why that is will be left to a discussion at a later time.
So here is a little more info to help drive home the point of how the MJO relates to our weather and its influences on a broad scale to the weather pattern. Below is the Euro MJO forecast going forward. Notice two things. 1) You can see the MJO has exited the circle of death(COD), as its called, and into its current position in phase 5 close to phase 4. What this means is if we look at a satellite we should see a broad region of convection (rising air leading to cloud cover with rain and thunderstorms) over the geographical region that correlates with phase 5. and 2) at the end of the forecast it looks to be strongly into phase 7 then 8(we will get to this point again further down)
" />Now lets quickly revisit the map with the phases and their geographic location for now pay particular attention to where phase 4 and 5 are:
" />Now look at this current sat image. In the circle in the bottom left corner you will notice there is exactly that, a broad area of disorganized convection. This is a pulse of the MJO in the phase 5 region(bordering the phase 4 region) of the graphics above.
" />If you recall in the write up I had from last night, once you get a pulse from the MJO, regardless of the phase (meaning the disorganized pulse of convection), it will propagate east and last on avg for typically 4-10days per phase. Sometimes propagating quicker sometimes slower, and sometimes dissipating along the way, aka crashing back into the COD. One other thing I want to point out on the Sat image above. Notice the LP I have drawn in. This is a tropical wave that is propagating west and eventually the LP will get organized and will eventually recurve south of the Equator and become a very powerful tropical cyclone for the southern hemisphere, but you can see how the convection, aka energy, from this tropical wave is actually feeding into the trough feature south of the Gulf of Alaska(GOA) as well as enhancing the STJ headed into Mexico's west coast. Behold an "atmospheric river" before your very eye.
Ok, still with me? Now lets focus on point two made above. Go back to the first graphic showing the Euro's MJO forecast. Let me explain one last thing about that graphic. All the yellow lines you see are all the individual runs by that model just like the ensembles we look at for surfaces etc. The Green line running through the middle is the mean of all those runs, and each sm black dot represents 24 hrs from the last dot. If you follow the black dots you will notice that in about 2-3 days the MJO pulse should propagate through the rest of phase 5 and into phase 6. In another 2-3 days it will continue propagating east into phases 7, and eventually in about 9-12days from now try and move into phase 8. Now remember using the sat image above starting in the current phase 5 visualize this wave of convection moving east ward through the phases.
Ok so how will this phase 7 and 8 possibly give up one last winter bang!? Some very smart people who have been studying the MJO over the past decade or so have recognized a statistical correlation between the phase of the MJO and the mean surface low pressure(MSLP) within certain regions of the globe. Lets look at phase 7 and 8. Below is a graphic that shows that when the MJO is in phases 7 and 8 that the MSLP in the region to the south of the Aleutian Islands has a lower anomaly(seen as blue colors)(Note: the red colors are higher pressure anomalies which typically indicates ridging). This means there is most likely going to be a trough there. As we should already know, or maybe your learning for the first time, a trough positioned in this area leads to a ridge along the west coast of North America. This ridge is broken up into two regions, the EPO and the PNA. A -EPO = ridge from W Canada up into Alaska, and a +PNA = ridge over western CONUS into W Canada. This ridge in turn then leads to a trough in the eastern third of the country. In phase 8 you can see there is a higher tendency for LP to develop off the EC as well.
" />So this leads to my take home point here. Since the MJO pulse looks to be very strong phase 7 and 8 in all likelihood the Aleution trough will be potent amplifying the ridge and trough down stream proportionally. The conditions for this ridging complex are still ideal when looking at the SST off the NA coast as they have been since last Jan. Just like the sat image above if this MJO forecast holds you will see a similar "atmospheric river" or strong tropical moisture transport feeding the Sub Aleutian trough and STJ into Mexico originating in the geographical location that correlates with those particular phases The energy from here in part will lead to short waves riding up over the ridging in the west and diving into the conus via the northern jet stream. In addition it will enhance an already active STJ. So if the timing is right between the 19th-24th or so we could get the northern and southern branches phase energies and boom! you get what yesterdays 00z GFS showed, a fully phased EC beast.
Look this is all potential. I have shown you how the MJO could lead to a very favorable upper level pattern for an EC storm to develop between the 19th and 24th. HOWEVER; 1) It doesn't mean the ingredients come together right and 2) the upper level forecast can still change this far out. So for now we sit back because we still have to get through the next week of a more relaxed pattern as the MJO moves through phases 5 and 6 over the next week or so. The last graphic shows the MSLP anomalies and their relation to MJO phases 5 and 6. Notice the reds south of the Aleutian Islands as well as along the EC which typically leads to more ridging in these locals which typically leads to a slightly warmer (relative to the past month or two) and dryer pattern in the northeast.
" />I will leave you with one final point about the influences of the MJO. The influences we see on our weather in the various phases is not the same during different times of the year. IE: a phase 7 or 8 in the winter leads to an entirely different upper level pattern when compared to a phase 7 or 8 in the summer. The details of why that is will be left to a discussion at a later time.
Last edited by sroc4 on Mon Mar 09, 2015 2:19 pm; edited 1 time in total
_________________
"In weather and in life, there's no winning and losing; there's only winning and learning."
WINTER 2012/2013 TOTALS 43.65"WINTER 2017/2018 TOTALS 62.85" WINTER 2022/2023 TOTALS 4.9"
WINTER 2013/2014 TOTALS 64.85"WINTER 2018/2019 TOTALS 14.25" WINTER 2023/2024 TOTALS 13.1"
WINTER 2014/2015 TOTALS 71.20"WINTER 2019/2020 TOTALS 6.35"
WINTER 2015/2016 TOTALS 35.00"WINTER 2020/2021 TOTALS 37.75"
WINTER 2016/2017 TOTALS 42.25"WINTER 2021/2022 TOTALS 31.65"
sroc4- Admin
- Posts : 8331
Reputation : 301
Join date : 2013-01-07
Location : Wading River, LI
Page 1 of 1
Permissions in this forum:
You cannot reply to topics in this forum|
|
|