
 Search
Solar - Minimum incoming

Solar - Minimum incoming
![]() by amugs Sun Mar 26, 2017 1:37 pm
by amugs Sun Mar 26, 2017 1:37 pm
First of all I have two things to point out – one by a famous Architect and Innovator Phillip Johnson – “the earth is spaceship traveling through the continuum of time in a 4th dimension we call space” – hurts to thinks about this I know. Secondly, the Sun our life of what gives us life is a massive fusion ball of energy that supplies and controls many meteorological happenings of our atmosphere/weather.
The sun in comparison to our planet!!

We have seen and recorded cycles of the sun’s affects like an ebb and flow of waves on our weather here from the ice ages to the saunas. I am not writing this to start a firestorm over global warming or climate change but to take research and present it. Question it if you will, refute, accept and open it up for discussion.
We have plotted the suns activity for hundreds of years now – how scientific well much more in the last few decades. It is an embryonic science at this point but very interesting to say the least. When the sun is not activity r is deemed low solar there are some profound effects on earth. One such effect from low solar activity is seismic activity hence earthquakes and volcanoes. Joe D'Aleo has written a paper and posts about such dating back to the 1500’s. Is this perfect – nothing is with science. There has recently in the past few years greater seismic activity of EQ and volcanoes erupting since these have been recorded in the early to mid-1800’s.
Great animation link of this: http://volcano.si.axismaps.io/
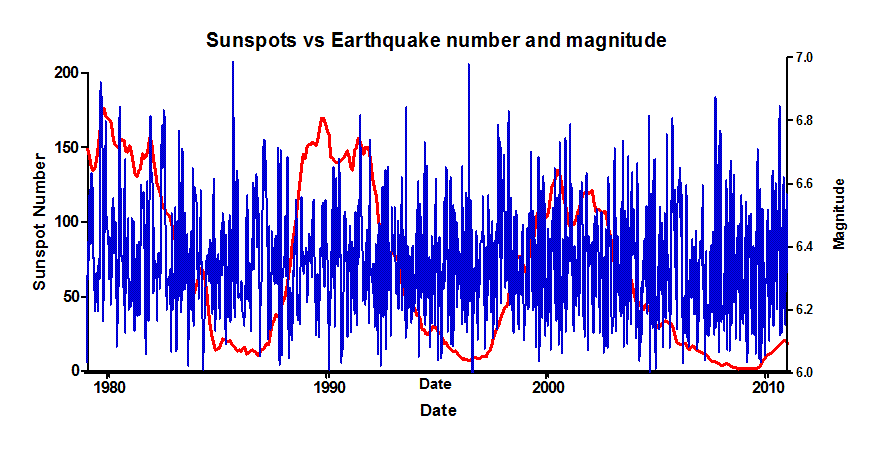
Red line is solar activity and you can see the number of seismic earthquakes increase with low solar on this chart.
Remember this it is not a snap your fingers and it happens but it is gradual in time over the course of years to possibly a decade. There is a direct correlation between the two as Joe D"aleo pointed out in his post on Wxbell this winter.
Now we are we with solar? Blank days and very low in green solar activity

This chart shows the greatest sun spotless days dating back to the late 1800's - correlation is less solar colder winters.
.png)
Well presently we have had a great stretch of no solar activity, meaning no sun spots or flares that eject off and out of the ball of fusion. When these occur if facing earth they will streak across the space at incredible speeds and reach or bombard our atmosphere with geo magnetic particles and heat. The northern lights have been stupendous these few years due to these solar storms as they are referred to. Another aspect of solar is coronal holes. These are massive holes that form on the sun’s surface and what goes much come out – they also eject massive amounts of geomagnetic particles. If the hole is facing the earth then we get the same as the solar spots affecting our planet. Such storm can be so big and strong they will knock out and disrupt telecommunications – satellites, cell phones, gps etc. All of such equipment is based of magnetic waves.
Follow this at this link:
http://spaceweather.com/
Spotless Days - we are at 16 straight days up until Friday
Current Stretch: 0 days
2017 total: 27 days (32%)
2016 total: 32 days (9%)
2015 total: 0 days (0%)
2014 total: 1 day (<1%)
2013 total: 0 days (0%)
2012 total: 0 days (0%)
2011 total: 2 days (<1%)
2010 total: 51 days (14%)
2009 total: 260 days (71%)
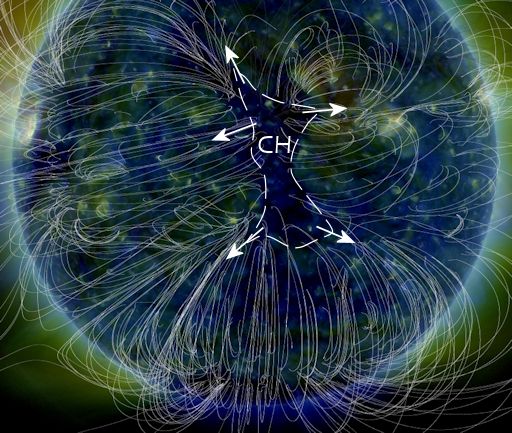
POTENT CORONAL HOLE FACES EARTH: A canyon-shaped hole in the sun's atmosphere is facing Earth, and it is spewing a stream of fast-moving solar wind toward our planet. NASA's Solar Dynamics Observatory photographed the giant fissure on March 25th:
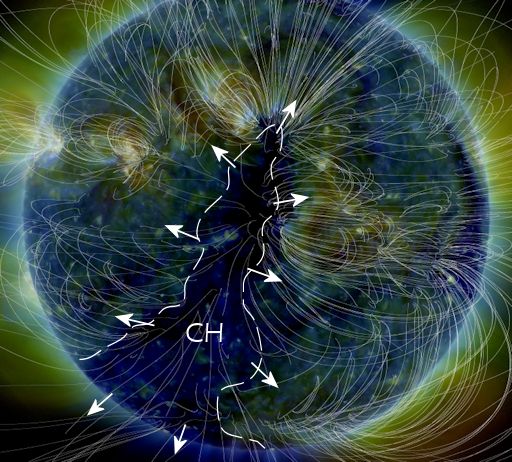
This is a "coronal hole" (CH) -- a vast region where the sun's magnetic field opens up and allows solar wind to escape. A gaseous stream flowing from this coronal hole is expected to reach our planet on during the late hours of March 27th and could spark moderately-strong G2-class geomagnetic storms around the poles on March 28th or 29th.
We've seen this coronal hole before. In early March, it lashed Earth's magnetic field with a fast-moving stream that sparked several consecutive days of intense auroras around the poles. The coronal hole is potent because it is spewing solar wind threaded with "negative polarity" magnetic fields. Such fields do a good job connecting to Earth's magnetosphere and energizing geomagnetic storms.
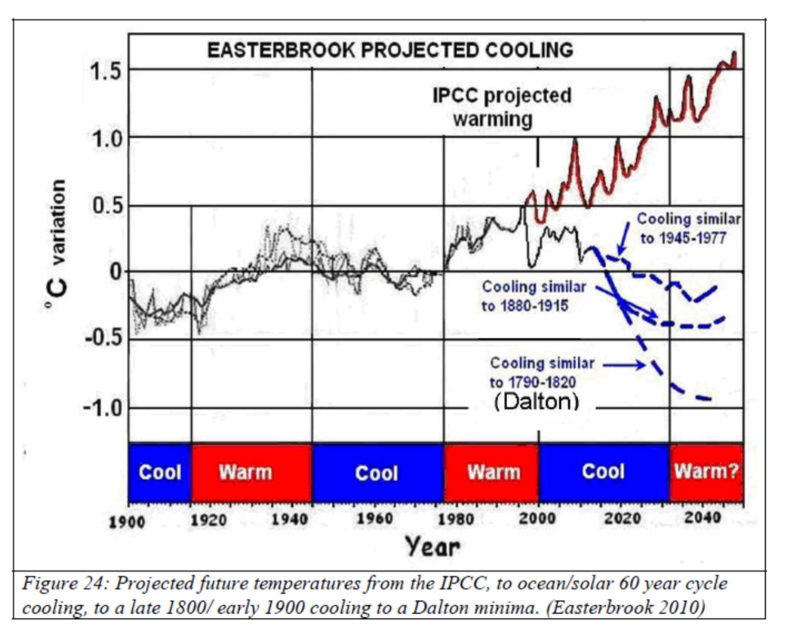
So where are we presently? This chart below tells the story and NASA monitors this daily.
This chart shows solar and its effects on the patterns of these different time periods.
Where are we going? Well it seems to be and is forecasted that we will be reaching a solar minimum in the next few years. How will this affect our weather? Well, if history is going to repeat itself which nature and man for that fact does over and over again looks to be of a snow lover’s delight. As per Dr. Theodor Landscheidt paper on the Little Ice Age years of such are 2019-20 through 2030 time frame. Are there other such factors that can accelerate or stymie this process? This remains to be seen. Here is the abstract from his paper on this:
“a long period of cool climate with its coldest phase around 2030 is to be expected. It is shown that minima in the 80 to 90-year Gleissberg cycle of solar activity, coinciding with periods of cool climate on Earth, are consistently linked to an 83-year cycle in the change of the rotary force driving the sun's oscillatory motion about the center of mass of the solar system. As the future course of this cycle and its amplitudes can be computed, it can be seen that the Gleissberg minimum around 2030 and another one around 2200 will be of the Maunder minimum type accompanied by severe cooling on Earth.”
He writes in his outlook:
We need not wait until 2030 to see whether the forecast of the next deep Gleissberg minimum is correct. A declining trend in solar activity and global temperature should become manifest long before the deepest point in the development. The current 11-year sunspot cycle 23 with its considerably weaker activity seems to be a first indication of the new trend, especially as it was predicted on the basis of solar motion cycles two decades ago. As to temperature, only El Niño periods should interrupt the downward trend, but even El Ninos should become less frequent and strong. The outcome of this further long-range climate forecast solely based on solar activity may be considered to be a touchstone.
He also talks about the terrestrial orbital cycles but more so their axis rotations of the big planets – Saturn, Uranus, Jupiter and Neptune and how these orbital paths can also alter the suns activity just by their own gravitational pulls. Closer orbits to the sun they pull harder thus leading to more solar activity and the other way around as well – this is a brief synopsis of his writing.

Joe D in his paper talks about this as well with this chart from 4 groups – 3 out of 4 say we are in a cooling period – on extreme to the Maunder time and one saying we are heading wards the medieval warm timeframe.

Solar Cycles and its meteorological effects

Hurricane theory and solar

In conclusion this is all forecasting at this point and scientists are at odds. One interesting theory is that the Northern Jet Stream is actually relocating itself, changing to a more southern periphery than what we have seen in modern times. Another theory is that the N and S poles are slowly swapping/changing their positions thus changing the geo magnetic properties of this phenomenon. There is speculation that the N pole is now centered over Siberian region of Russia, some say over Greenland and the South Pole over the South American continent in the lower Chile coastal mountain region. Thus the lower latitude Northern lights these past few years in this region. (Northern Lights are geomagnetic particles that illuminate at night and are attracted to the magnetic poles). The poles due in fact wobble and have flipped before as early as 800K years ago so are we in this process as well?

I hope you have found this interesting and a good logical read. Something I have on my spare time researching along with a friend.
Last edited by amugs on Sun Mar 26, 2017 8:09 pm; edited 1 time in total
_________________
Mugs
AKA:King: Snow Weenie
Self Proclaimed
WINTER 2014-15 : 55.12" +.02 for 6 coatings (avg. 35")
WINTER 2015-16 Total - 29.8" (Avg 35")
WINTER 2016-17 : 39.5" so far
amugs- Advanced Forecaster - Mod

- Posts : 15093
Reputation : 213
Join date : 2013-01-07
Age : 54
Location : Hillsdale,NJ
Re: Solar - Minimum incoming
![]() by Dunnzoo Sun Mar 26, 2017 3:01 pm
by Dunnzoo Sun Mar 26, 2017 3:01 pm
_________________
Janet
Snowfall winter of 2023-2024 17.5"
Snowfall winter of 2022-2023 6.0"
Snowfall winter of 2021-2022 17.6" 1" sleet 2/25/22
Snowfall winter of 2020-2021 51.1"
Snowfall winter of 2019-2020 8.5"
Snowfall winter of 2018-2019 25.1"
Snowfall winter of 2017-2018 51.9"
Snowfall winter of 2016-2017 45.6"
Snowfall winter of 2015-2016 29.5"
Snowfall winter of 2014-2015 50.55"
Snowfall winter of 2013-2014 66.5"
Dunnzoo- Senior Enthusiast - Mod
- Posts : 4886
Reputation : 68
Join date : 2013-01-11
Age : 62
Location : Westwood, NJ
Re: Solar - Minimum incoming
![]() by Frank_Wx Sun Mar 26, 2017 6:28 pm
by Frank_Wx Sun Mar 26, 2017 6:28 pm
_________________
_______________________________________________________________________________________________________
CLICK HERE to view NJ Strong Snowstorm Classifications

Frank_Wx- Godzilla Seeker

- Posts : 21305
Reputation : 328
Join date : 2013-01-05
Age : 31
Location : Jersey City, NJ -

Re: Solar - Minimum incoming
![]() by frank 638 Sun Mar 26, 2017 6:41 pm
by frank 638 Sun Mar 26, 2017 6:41 pm
frank 638- Senior Enthusiast

- Posts : 2824
Reputation : 37
Join date : 2016-01-01
Age : 40
Location : bronx ny
Re: Solar - Minimum incoming
![]() by amugs Sun Mar 26, 2017 8:02 pm
by amugs Sun Mar 26, 2017 8:02 pm
frank 638 wrote:excellent write up amugs and thank you for your post and maps you put up .i am also hearing we might have a mini iceage by 2019 i dont know how true this will be
Thank Frank squared here - it is quite possible that we have a very much colder winter in 2019 and 2020. Mini ice age I dont know about that so much BUT we could have a colder than normal (what the h is normal lately right - this would be normal for teh 5=40-60's time frame is my guess.
There are more variables for this to happen (ice age) IMO BUT the correlation (Zoo) to this in answer to your question earlier is that when we have low solar we have lower geomagnetic activity bombarding or equalizing the balance between teh atmosphere/space and our own magnetic system so to speak. WHen it i slow this balance from what I have read has to be equalized out thus putting pressure on our system that basically snaps and explodes outward this sending out to tis balance region geomagnetic waves.
It is like two waves equalizing each otehr out - when one disappears then the other wave has no resistance so it therefore will move or explode at will. This si how i have come to understand this. Some refute this but the correlation to me is quite telling. Just be clear earthquakes are in this timeframes of low solar are USUALLY precursors to volcanic activity in the mid to high latitude regions. As far as the tropical latitudes I do not know but suspect this would also effect this region.
_________________
Mugs
AKA:King: Snow Weenie
Self Proclaimed
WINTER 2014-15 : 55.12" +.02 for 6 coatings (avg. 35")
WINTER 2015-16 Total - 29.8" (Avg 35")
WINTER 2016-17 : 39.5" so far
amugs- Advanced Forecaster - Mod
- Posts : 15093
Reputation : 213
Join date : 2013-01-07
Age : 54
Location : Hillsdale,NJ
Re: Solar - Minimum incoming
![]() by CyphaPSU Mon Mar 27, 2017 7:17 am
by CyphaPSU Mon Mar 27, 2017 7:17 am
CyphaPSU- Posts : 8
Reputation : 0
Join date : 2016-10-05
Location : Yardley, PA
Re: Solar - Minimum incoming
![]() by rb924119 Mon Mar 27, 2017 12:38 pm
by rb924119 Mon Mar 27, 2017 12:38 pm
rb924119- Meteorologist

- Posts : 6889
Reputation : 194
Join date : 2013-02-06
Age : 32
Location : Greentown, Pa
Re: Solar - Minimum incoming
![]() by amugs Mon Mar 27, 2017 1:41 pm
by amugs Mon Mar 27, 2017 1:41 pm
CyphaPSU wrote:Thanks amugs for your informative post, it is timely for me. I have been teaching my earth science students about solar activity, sunspots, possible effects on our weather, and the Maunder Minimum over this past week.
WE ARE...................
Great hope it helped - any questions or more information let me know or you would like to add or refute please go right ahead. I also teach, engineering and CAD here in NNJ and runa weather club too
_________________
Mugs
AKA:King: Snow Weenie
Self Proclaimed
WINTER 2014-15 : 55.12" +.02 for 6 coatings (avg. 35")
WINTER 2015-16 Total - 29.8" (Avg 35")
WINTER 2016-17 : 39.5" so far
amugs- Advanced Forecaster - Mod
- Posts : 15093
Reputation : 213
Join date : 2013-01-07
Age : 54
Location : Hillsdale,NJ
Re: Solar - Minimum incoming
![]() by amugs Mon Mar 27, 2017 1:43 pm
by amugs Mon Mar 27, 2017 1:43 pm
rb924119 wrote:Mugs, this is a wonderful thread, and one that I think deserves to be expanded. For example, a further step that this could lead to is to perform a case study (and maybe this has already been done by published scientists) where we compare the several main solar cycles and recorded sunspot activity with cycles in things such as the PDO, AMO, and IOD to see whether or not there is a similar temporal pattern in the temperature anomalies (i.e. does high-solar activity create a cyclical and relatively regular lagged effect in the world's major bodies of water such that as solar fluxes wane, the oceans then release the stored heat energy in the form of positive low-level heat flux via above normal SSTs which warm the planet, and vice-versa, to create an inverse relationship?). I know, and you also mentioned, Joe D'Aleo has done some work with this, and has a beautiful graphic of solar activity overlaid with the El-Niño/La-Niña cycles, and intuitively demonstrates the "for instance" mentioned above, but it would also be cool to look at this on a grander scale. Intuitively, it would only make sense that there would have to be at least some correlation between the two, but it would be very interesting to see what data showed. This might be an idea for a future case study if somebody else doesn't beat me to it!!
Holy rb you read my mind - I was just talking our environmental studies teacher here and said the potential for this is tremendous. I concur with you and when I find some time I will do more research but that is slim o none know! Go right ahead my mini genius and take this home.
Fascinating topic that we poo poo in terms of weather and we have to stop denying this.
_________________
Mugs
AKA:King: Snow Weenie
Self Proclaimed
WINTER 2014-15 : 55.12" +.02 for 6 coatings (avg. 35")
WINTER 2015-16 Total - 29.8" (Avg 35")
WINTER 2016-17 : 39.5" so far
amugs- Advanced Forecaster - Mod
- Posts : 15093
Reputation : 213
Join date : 2013-01-07
Age : 54
Location : Hillsdale,NJ
Re: Solar - Minimum incoming
![]() by rb924119 Mon Mar 27, 2017 2:07 pm
by rb924119 Mon Mar 27, 2017 2:07 pm
amugs wrote:rb924119 wrote:Mugs, this is a wonderful thread, and one that I think deserves to be expanded. For example, a further step that this could lead to is to perform a case study (and maybe this has already been done by published scientists) where we compare the several main solar cycles and recorded sunspot activity with cycles in things such as the PDO, AMO, and IOD to see whether or not there is a similar temporal pattern in the temperature anomalies (i.e. does high-solar activity create a cyclical and relatively regular lagged effect in the world's major bodies of water such that as solar fluxes wane, the oceans then release the stored heat energy in the form of positive low-level heat flux via above normal SSTs which warm the planet, and vice-versa, to create an inverse relationship?). I know, and you also mentioned, Joe D'Aleo has done some work with this, and has a beautiful graphic of solar activity overlaid with the El-Niño/La-Niña cycles, and intuitively demonstrates the "for instance" mentioned above, but it would also be cool to look at this on a grander scale. Intuitively, it would only make sense that there would have to be at least some correlation between the two, but it would be very interesting to see what data showed. This might be an idea for a future case study if somebody else doesn't beat me to it!!
Holy rb you read my mind - I was just talking our environmental studies teacher here and said the potential for this is tremendous. I concur with you and when I find some time I will do more research but that is slim o none know! Go right ahead my mini genius and take this home.
Fascinating topic that we poo poo in terms of weather and we have to stop denying this.
Hahaha and yeah it is! Think about it; this really could be a Master's Thesis. As far as carrying out the study, I doubt that I'll have any time to devote to it over the coming Spring, Summer, and maybe even Autumnal months..........I'm actually already in the process of doing something ELSE for our board, of which ONLY our fearless leader currently knows
rb924119- Meteorologist
- Posts : 6889
Reputation : 194
Join date : 2013-02-06
Age : 32
Location : Greentown, Pa
Re: Solar - Minimum incoming
![]() by amugs Mon Mar 27, 2017 8:50 pm
by amugs Mon Mar 27, 2017 8:50 pm
Ray looking forward to the surprise on here.
Also, how crazy is this, this article was twet3d out by JB yesterday at 2PM
A fantastic read on solar and the Azone High and Ray about the water vapor and lag efeats on the oceans to a degree
http://notrickszone.com/2017/03/25/fascinating-new-studies-confirm-solar-activity-plays-important-role-on-driving-climate/#sthash.bA1ffh0b.pMj5WIpK.dpbs
_________________
Mugs
AKA:King: Snow Weenie
Self Proclaimed
WINTER 2014-15 : 55.12" +.02 for 6 coatings (avg. 35")
WINTER 2015-16 Total - 29.8" (Avg 35")
WINTER 2016-17 : 39.5" so far
amugs- Advanced Forecaster - Mod
- Posts : 15093
Reputation : 213
Join date : 2013-01-07
Age : 54
Location : Hillsdale,NJ
Re: Solar - Minimum incoming
![]() by billg315 Tue Mar 28, 2017 4:45 pm
by billg315 Tue Mar 28, 2017 4:45 pm

billg315- Advanced Forecaster - Mod
- Posts : 4462
Reputation : 185
Join date : 2015-01-24
Age : 50
Location : Flemington, NJ
Re: Solar - Minimum incoming
![]() by Isotherm Tue Mar 28, 2017 5:21 pm
by Isotherm Tue Mar 28, 2017 5:21 pm
Great post with well researched assertions. Much of this discussion overlaps with global climate change as well. I have done some significant climate / solar research and have quite a few studies to share when I get more time. However - your points are accurate regarding seismic, volcanic, activity among others. I will address your post more extensively probably this weekend. Re Ray's point above regarding the lagged effect, that is also true and demonstrated in the literature. I have been meaning to respond to our climate thread on usawx with these studies actually, so that's a funny coincidence you created this thread here.
Isotherm- Advanced Forecaster

- Posts : 231
Reputation : 4
Join date : 2014-09-01
Age : 33
Location : Monmouth County, NJ -
Re: Solar - Minimum incoming
![]() by amugs Tue Mar 28, 2017 7:23 pm
by amugs Tue Mar 28, 2017 7:23 pm
Isotherm wrote:Mugs,
Great post with well researched assertions. Much of this discussion overlaps with global climate change as well. I have done some significant climate / solar research and have quite a few studies to share when I get more time. However - your points are accurate regarding seismic, volcanic, activity among others. I will address your post more extensively probably this weekend. Re Ray's point above regarding the lagged effect, that is also true and demonstrated in the literature. I have been meaning to respond to our climate thread on usawx with these studies actually, so that's a funny coincidence you created this thread here.
Tom, thank you and I look forward to reading your research which I know will be spot on!
I had a long convo with one of our staff members today about this said correlation and it is very interesting.
The Pole movement to me is just as fascinating and they have some evidence that this is presently occurring.
It is interesting to note that I read an article from an IIPC scientist who is trying to refute the evidence that low oslar leads to more seismic activity, volcanoes.
Remember, these can last for years, decades before we settle into said such period. Look at he Maunder Minimum - lasted a couple of hundred years overall with from what Ray and Tom have pointed out a lag effect if yuo actually take the time frame of the start to finish not just the bulk of the period - like a bell shape curve or wave - not just the middle but the beginning and and end.
I am going to post my post over on teh USAwx site as well and if others would like to share on other site or with friends over some pops please do!
This CO2 graph is WOW.

_________________
Mugs
AKA:King: Snow Weenie
Self Proclaimed
WINTER 2014-15 : 55.12" +.02 for 6 coatings (avg. 35")
WINTER 2015-16 Total - 29.8" (Avg 35")
WINTER 2016-17 : 39.5" so far
amugs- Advanced Forecaster - Mod
- Posts : 15093
Reputation : 213
Join date : 2013-01-07
Age : 54
Location : Hillsdale,NJ
Re: Solar - Minimum incoming
![]() by rb924119 Tue Mar 28, 2017 8:02 pm
by rb924119 Tue Mar 28, 2017 8:02 pm
Isotherm wrote:Mugs,
Great post with well researched assertions. Much of this discussion overlaps with global climate change as well. I have done some significant climate / solar research and have quite a few studies to share when I get more time. However - your points are accurate regarding seismic, volcanic, activity among others. I will address your post more extensively probably this weekend. Re Ray's point above regarding the lagged effect, that is also true and demonstrated in the literature. I have been meaning to respond to our climate thread on usawx with these studies actually, so that's a funny coincidence you created this thread here.
I had a feeling it was haha I would find it hard to believe that nobody has at least started to look into that. I'd LOVE to see your research as well if/when you have the opportunity, as I'm sure it's top notch.
rb924119- Meteorologist
- Posts : 6889
Reputation : 194
Join date : 2013-02-06
Age : 32
Location : Greentown, Pa
Re: Solar - Minimum incoming
![]() by Isotherm Sat May 06, 2017 8:06 pm
by Isotherm Sat May 06, 2017 8:06 pm
It is generally incontrovertible that a doubling of Co2 imparts 3.7 +/- 0.4 W/m2 of radiative forcing at the tropopause, and some hypothesize that this energy imbalance can only be remedied via an increase in tropospheric temperatures. The inquiry to pose is not whether Co2 imparts additional radiative forcing, but what precisely is the Earth system response, particularly insofar as its sensitivity (quantified with values such as TCR and ECS). Those who subscribe to doomsday type scenarios typically foresee realized ECS values of at least 2.5C to upwards of 4C (keep in mind, ECS involves full equilibration while TCR is less than 100 years). However, there is a significant amount of literature which concludes much lower ECS values, on the order of 1.0c-1.5c and even under 1.0c. Co2 radiative forcing is hypothesized to induce a tropospheric temperature increase of approximately 1.0c. This is somewhat irrelevant though, in light of the fact that Earth's feedback systems will alter (possibly significantly) the resultant value. Both the magnitude and direction of the feedbacks are in dispute as far as the real literature is concerned, with the lower (higher) ECS values asserting net negative (positive) feedbacks. One integral feedback process is the development of low level cloudiness due to the fact that these clouds are predominately sfc-cooling rather than heat trapping (e.g., higher level clouds).
Now, in terms of the solar component -- one is grossly underestimating the effects of solar activity by only examining TSI. There are solar amplification mechanisms beyond TSI (variations in UV radiation and corresponding modulation of atmospheric ozone chemistry, thus, indirectly affecting climate; changes in radiative forcing due to less (more) clouds via decreases (increases) in cosmic rays; cosmic ray impact on the lower stratospheric ozone budget, the influence of ozone on the temperature/humidity trends near the tropopause and consequently the greenhouse effect; variations in geomagnetic activity, particularly concerning their impact at higher latitudes, and finally, the cumulative forcing induced by successive solar cycles of high magnitude on the climate regime). Accumulated solar energy has a much higher correlation to global temperature than sunspot cycling. Due to the Earth's thermal inertia via the slower equilibration induced by the oceans, it takes awhile for the full effects of heightened solar forcing to manifest in terms of surface temperatures. And thus, multiple similar strong solar cycles, while not increasing in magnitude, will certainly aid in enhancing the warming over time. This is why many are incorrect in expecting a quick and sudden drop in global temperatures in the past decade, immediately during/following one less active cycle. A pot on a stove will not necessarily begin cooling if one decreases the intensity of the burner. If the incoming energy is still greater than or equal to the established equilibrium point, cooling will not commence. The point of equivalency, namely, energy inputted = energy output, has not yet been reached insofar as the Earth system in my opinion. Only about 20% of the oceans receive solar insolation; thus, conduction and fluid motion are responsible for the equilibration process which is extremely protracted. Statistical relationships between solar forcing and sfc T are therefore usually nonexistent if one does not consider temporal dissociation w/ the pathways of response.
It is unsurprising to me that global temperatures surged in late 1990s, approximately 30-40 years subsequent to peak solar forcing in the 1960s. Accumulated solar energy and concomitant oceanic thermal inertia necessitates a lagged sfc T response.
The following are studies corroborating the aforementioned assertions.
Identification of a 10-30 year lag b/t solar forcing and temperature response:
http://onlinelibrary.wiley.com/doi/10.1029/2008GL035930/full
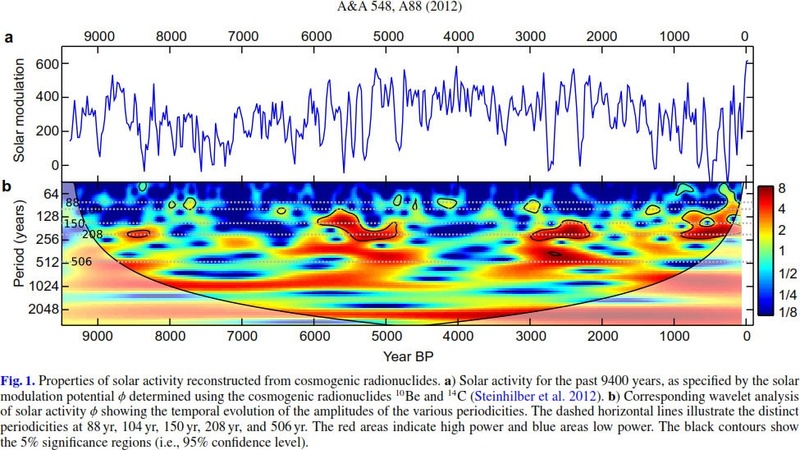
The following paper demonstrates that solar activity in the most recent period was at its highest levels in 9,400 years.
https://www.aanda.org/index.php?option=com_article&access=doi&doi=10.1051/0004-6361/201219997&Itemid=129
This paper - "Revisiting the Sunspot Number - A 400-Year Perspective on the Solar Cycle" Frédéric Clette · Leif Svalgaard · José M. Vaquero ·
Edward W. Cliver
Important quote from the study:
"Still, although the levels of activity were not exceptional except maybe for cycle 19, the particularly long sequence of strong cycles in the late 20th remains a noteworthy episode. Indeed, the 400-year sunspot record and one of its by products, the number of spotless days, show that such a tight sequence of 5 strong cycles over 6 successive cycles (from 17 to 22, except 20), which we can call the “Modern Maximum”, is still unique over at least the last four centuries. Given the inertia of natural systems exposed to the solar influences, like the Earth atmosphere-ocean system, this cycle clustering could still induce a peak in the external responses to solar activity, like the Earth climate. However, we conclude that the imprint of this Modern Maximum (e.g. Earth climate forcing) would essentially result from time-integration effects (system inertia) [i.e. the sunspot time-integral]."
Another paper demonstrating that variation in SSN leads T by 30-40 years:
https://www.researchgate.net/publication/268882338_Correlation_between_solar_activity_and_the_local_temperature_of_Antarctica_during_the_past_11000_years
If one merely juxtaposes the global temperature anomaly record of the late 1800s and early 1900s, one can see the effect of thermal inertia to which I refer herein. The onset of cooling initiated 7-10 years following very low solar forcing with the minimum in global temperatures achieved at least 25 years subsequent to the initiation of suppressed solar forcing.
Below are several papers demonstrating ECSs of 0.5c to 1.5c:
ECS 1.35C:
http://arxiv.org/abs/1307.3706
ECS 1.1C:
http://webcache.googleusercontent.com/search?q=cache:3b7otVla9qgJ:www-eaps.mit.edu/faculty/lindzen/236-Lindzen-Choi-2011.pdf+&cd=1&hl=en&ct=clnk&gl=us
ECS 1.5C:
http://arxiv.org/abs/1310.7554
ECS 0.6C:
http://www.seipub.org/des/paperInfo.aspx?ID=17162
ECS 0.6C:
http://www.scipublish.com/journals/ACC/papers/846
To disambiguate: in totality, my argument - simplified and elucidated - is as follows: anthropogenic climate change exists and Co2 radiative forcing is legitimate; however, the solar forcing component is significantly underestimated given their is a myopic proclivity to concentrate on TSI variations, while concurrently failing to recognize the other, integral modulatory mechanisms of the Sun. Further, the effects of thermal inertia are largely ignored, which plays an exceptionally influential role in determining the atmospheric response time. The rate of warming/cooling will alter as a function of forcing alterations, but cooling will not initiate until forcing is sufficiently low to fall below the current, established equilibrium. If my and innumerable other scientists' hypotheses are correct, sfc T response is still ahead of us. I think the rate of warming will continue to decrease over the coming two years with the onset of cooling (versus 1998-present levels) likely to occur within the next several years. The magnitude of the cooling (speculation) over the course of the next two decades could be 0.3 or 0.4c, bringing us down near global temperatures of the 1980s. Again, the key question here is relative attribution of Co2 RF vs solar RF; we shall see what we shall see.
Isotherm- Advanced Forecaster
- Posts : 231
Reputation : 4
Join date : 2014-09-01
Age : 33
Location : Monmouth County, NJ -
Re: Solar - Minimum incoming
![]() by docstox12 Sun May 07, 2017 11:32 am
by docstox12 Sun May 07, 2017 11:32 am

docstox12- Wx Statistician Guru

- Posts : 8502
Reputation : 222
Join date : 2013-01-07
Age : 73
Location : Monroe NY
Re: Solar - Minimum incoming
![]() by Isotherm Wed May 10, 2017 10:04 pm
by Isotherm Wed May 10, 2017 10:04 pm
docstox12 wrote:Tom, excellent dissertation extrapolating on Mugsy's analysis.Very interesting that lag in surface temps as per solar activity be it up or down.It will be interesting to see how this all plays out the next 10 or 20 years.Thanks for posting this, I learned things I never knew.
Thank you Doc, appreciate it. It certainly will be very interesting, and I for one am excited to live through these times climate wise.
I stumbled upon this study recently which was published in late 2016 by Dr. Abdussamatov. It corroborates my assertions noted hitherto regarding the energy imbalance and concomitant delayed equilibration induced partially by oceanic thermal inertia. See the following.
http://www.sciencedirect.com/science/article/pii/B9780128045886000173
"Since 1990, the Sun has been in the declining phase of the quasi-bicentennial variation in total solar irradiance (TSI). The decrease in the portion of TSI absorbed by the Earth since 1990 has remained uncompensated by the Earth's long-wave radiation into space at the previous high level because of the thermal inertia of the world's oceans. As a result, the Earth has, and will continue to have, a negative average annual energy balance and a long-term adverse thermal condition. The quasi-centennial epoch of the new Little Ice Age has started at the end 2015 after the maximum phase of solar cycle 24. The start of a solar grand minimum is anticipated in solar cycle 27 ± 1 in 2043 ± 11 and the beginning of phase of deep cooling in the new Little Ice Age in 2060 ± 11. The gradual weakening of the Gulf Stream leads to stronger cooling in the zone of its action in western Europe and the eastern parts of the United States and Canada. Quasi-bicentennial cyclic variations of TSI together with successive very important influences of the causal feedback effects are the main fundamental causes of corresponding alternations in climate variation from warming to the Little Ice Age."
Isotherm- Advanced Forecaster
- Posts : 231
Reputation : 4
Join date : 2014-09-01
Age : 33
Location : Monmouth County, NJ -
Re: Solar - Minimum incoming
![]() by Isotherm Thu May 11, 2017 8:26 pm
by Isotherm Thu May 11, 2017 8:26 pm
Interestingly enough, this line of argumentation invokes precisely the same mechanisms to which I referred earlier, namely, the oceanic thermal inertia.
See the following website excerpt, which is strongly pro-AGW:
https://www.skepticalscience.com/Climate-Change-The-40-Year-Delay-Between-Cause-and-Effect.html
"The reason the planet takes several decades to respond to increased CO2 is the thermal inertia of the oceans. Consider a saucepan of water placed on a gas stove. Although the flame has a temperature measured in hundreds of degrees C, the water takes a few minutes to reach boiling point. This simple analogy explains climate lag. The mass of the oceans is around 500 times that of the atmosphere. The time that it takes to warm up is measured in decades. Because of the difficulty in quantifying the rate at which the warm upper layers of the ocean mix with the cooler deeper waters, there is significant variation in estimates of climate lag. A paper by James Hansen and others [iii] estimates the time required for 60% of global warming to take place in response to increased emissions to be in the range of 25 to 50 years. The mid-point of this is 37.5 which I have rounded to 40 years."
Their time frame of circa 40 years coincides quite nicely with the time lags posited by the studies I posted in regards to accumulated solar energy. The peak solar forcing of the 1960s yielded the fastest rate of temperature increase in the 1995-2005 period.
Isotherm- Advanced Forecaster
- Posts : 231
Reputation : 4
Join date : 2014-09-01
Age : 33
Location : Monmouth County, NJ -
Re: Solar - Minimum incoming
![]() by rb924119 Fri May 12, 2017 12:06 am
by rb924119 Fri May 12, 2017 12:06 am
rb924119- Meteorologist
- Posts : 6889
Reputation : 194
Join date : 2013-02-06
Age : 32
Location : Greentown, Pa
Re: Solar - Minimum incoming
![]() by Isotherm Sat May 13, 2017 5:24 pm
by Isotherm Sat May 13, 2017 5:24 pm
rb924119 wrote:Tom, excellent posts!!!! Definitely going to revisit thread and get me learning on!! Thank you for all of your hard work and dedication!!!
Thanks, Ray! It's an important argument that I rarely see people broach in this issue.
Will be interesting to observe the coming decade of climate variations.
Isotherm- Advanced Forecaster
- Posts : 231
Reputation : 4
Join date : 2014-09-01
Age : 33
Location : Monmouth County, NJ -
Re: Solar - Minimum incoming
![]() by amugs Sat May 13, 2017 11:14 pm
by amugs Sat May 13, 2017 11:14 pm
Great work here and there is lots to ocme and learn.
Speaking of :
SUNSPOT COUNTS ARE PLUMMETING: Today marks the 4th day in a row and the 34th day in 2017 that the sun has been blank--no sunspots. This exceeds the total number of spotless days in all of 2016 (32). The accelerating pace of spotlessness is a sign that Solar Minimum is approaching. Forecasters expect the sunspot cycle, which swings like a pendulum between high and low sunspot number every ~11 years, to reach its nadir in 2019-2020. Stay tuned for more blank suns
Coronal Hole issue that will help bring the warmth!! Check out the timing hmmmmm............
A CORONAL HOLE TURNS TOWARD EARTH: A hole in the sun's atmosphere has opened, and it is directly facing Earth. NASA's Solar Dynamics Observatory photographed the structure on May 13th:
This is a coronal hole (CH)--a region where the sun's magnetic field opens up and allows solar wind to escape. The gaseous stream emerging from this hole is expected to reach Earth during the late hours of May 15th, possibly causing mild geomagnetic storms around the poles when it arrives. High-latitude sky watchers should be alert for auroras, especially in the southern hemisphere where deepening autumn darkness favors visibility
_________________
Mugs
AKA:King: Snow Weenie
Self Proclaimed
WINTER 2014-15 : 55.12" +.02 for 6 coatings (avg. 35")
WINTER 2015-16 Total - 29.8" (Avg 35")
WINTER 2016-17 : 39.5" so far
amugs- Advanced Forecaster - Mod
- Posts : 15093
Reputation : 213
Join date : 2013-01-07
Age : 54
Location : Hillsdale,NJ
|
|
|