
 Search
Weather Statistics Thread
Page 3 of 14 •  1, 2, 3, 4 ... 8 ... 14
 ![]()
Re: Weather Statistics Thread
![]() by CPcantmeasuresnow Fri Feb 17, 2017 9:10 am
by CPcantmeasuresnow Fri Feb 17, 2017 9:10 am
As of today February is already 2-3 degrees above normal area wide for the month , factor in the torch for the next 10 days and we will easily end up 6-8 degrees above normal again.
This will mark the 20th consecutive month of above normal temperatures. I know the climate has gotten much warmer in just the 45 or so years I've been observing but this streak is ridiculous.
NYC......................42/29
Newark..................43/27
LI/Islip...................40/25
Bridgeport CT........40/25
HV/Poughkeepsie....40/18
Binghamton...........32/17
Albany...................35/17
Hartford CT............39/21
NE PA/Scranton......37/21
CNJ/Trenton...........42/26
SNJ/Atlantic City.....44/26
One interesting thing to observe from the above normal temperatures for this date, is even though NYC is located north or close to the same latitude as many of these locations it still has the highest average temperature due IMO to the tremendous UHI effect. For the most part this keeps their low temperatures from falling as low as most locations within a 75 mile radius no matter what direction these places are from the city.
CPcantmeasuresnow- Wx Statistician Guru

- Posts : 7274
Join date : 2013-01-07
Re: Weather Statistics Thread
![]() by CPcantmeasuresnow Fri Feb 17, 2017 11:32 pm
by CPcantmeasuresnow Fri Feb 17, 2017 11:32 pm
Last edited by CPcantmeasuresnow on Sat Feb 18, 2017 8:20 am; edited 1 time in total
CPcantmeasuresnow- Wx Statistician Guru
- Posts : 7274
Join date : 2013-01-07
Re: Weather Statistics Thread
![]() by docstox12 Sat Feb 18, 2017 6:18 am
by docstox12 Sat Feb 18, 2017 6:18 am

docstox12- Wx Statistician Guru
- Posts : 8507
Reputation : 222
Join date : 2013-01-07
Age : 73
Location : Monroe NY
Re: Weather Statistics Thread
![]() by CPcantmeasuresnow Sat Feb 18, 2017 8:17 am
by CPcantmeasuresnow Sat Feb 18, 2017 8:17 am
Last edited by CPcantmeasuresnow on Sun Feb 19, 2017 9:10 am; edited 11 times in total

CPcantmeasuresnow- Wx Statistician Guru
- Posts : 7274
Reputation : 230
Join date : 2013-01-07
Age : 103
Location : Eastern Orange County, NY
Re: Weather Statistics Thread
![]() by Frank_Wx Sat Feb 18, 2017 8:47 am
by Frank_Wx Sat Feb 18, 2017 8:47 am
_________________
_______________________________________________________________________________________________________
CLICK HERE to view NJ Strong Snowstorm Classifications

Frank_Wx- Godzilla Seeker

- Posts : 21305
Reputation : 328
Join date : 2013-01-05
Age : 31
Location : Jersey City, NJ -

Re: Weather Statistics Thread
![]() by CPcantmeasuresnow Sun Feb 19, 2017 9:08 am
by CPcantmeasuresnow Sun Feb 19, 2017 9:08 am
Below is a breakdown of 30 day periods beginning November 1st in NYC and incremented by 7 day intervals of how many 6+ and 10+ inch storms have occurred during those 30 day periods since NYC has kept records in 1870. To put the list in perspective there have been 65 10+ inch storms and 189 6+ inch storms in NYC since 1870. The peak 30 day periods historically in NYC have been any 30 day period between early January through the first couple of days of March, highlighted in red below. Beginning in March the chances gradually decrease to eventually zero after April 13th which is the latest day of a recorded 10 inch snowfall in NYC in recorded history.
Unfortunately the NYC area will be moving out of it's peak period for significant snowfalls by the end of February but the period February 7th to March 7th has seen a very substantial 22 10+ inch snows and 65 storms of 6+ inches. Highlighted in bold any 30 day period from January 10th through March 8th is prime time in NYC. After that especially after the spring equinox the total number of 6+ and 10+ inch storms drops off quite precipitously.
Begin Date..........End Date......10+ inch...6+ inch
November-01.......November-30........1........4
November-08.......December-07........2.......10
November-15...... December-14...... .3.......15
November-22.......December-21........7.......24
November-29...... December-28.......11......38
December-06...... January-04..........14.......41
December-13.......January-11..........13.......43
December-20...... January-18..........14.......42
December-27...... January-25..........14.......40
January-03......... February-01.........14.......44
January-10........February-08.......22......60
January-17........February-15.......28......68
January-24........February-22.......28......68
January-31........March-01............26......70
February-07......March-08............22......65
February-14........March-15..............15......48
February-21....... March-22..............11......40
February-28....... March-29................9......30
March-07........... April-05..................7......17
March-14........... April-12..................4......15
March-21........... April-19..................2........8
March-27........... April-25..................2........7
April-04............. May-03...................2........6
April-11............. May-10...................1........1
Of course as you go North and West of NYC these periods start earlier and go later and decrease as you go south of the city.
Last edited by CPcantmeasuresnow on Sun Feb 26, 2017 12:37 pm; edited 3 times in total
CPcantmeasuresnow- Wx Statistician Guru
- Posts : 7274
Reputation : 230
Join date : 2013-01-07
Age : 103
Location : Eastern Orange County, NY
Re: Weather Statistics Thread
![]() by docstox12 Mon Feb 20, 2017 6:18 am
by docstox12 Mon Feb 20, 2017 6:18 am
docstox12- Wx Statistician Guru
- Posts : 8507
Reputation : 222
Join date : 2013-01-07
Age : 73
Location : Monroe NY
Re: Weather Statistics Thread
![]() by Math23x7 Thu Feb 23, 2017 10:54 pm
by Math23x7 Thu Feb 23, 2017 10:54 pm
And while we’re on topic, I also computed the high/low temperatures for December 2016 and January 2017 and it looks to be in the top 10 in the warmest winters on record. A couple of days ago, I thought perhaps seventh warmest. However, we may in fact get it to the sixth warmest winter on record. And think about this. Assuming that this meteorological winter finishes in the top eight, it would mean the seven of the eight warmest winters on record have occurred in my lifetime (and I’m only 26 years old).
There’s no other way to put it. I have never experienced the year after year bitter cold that the older folks on the forum have experienced. Have we had cold months in the last 26 years? Yes. More specifically January 2004 and February 2015. But looking at weather records from the 60’s and 70’s, I’m sure it must be stunning for even you guys to be experiencing the warm winters the last several decades.
That being said, the good side to being 26 is that I did not experience the snow drought of the 1980’s. That must have been depressing. I mean seasonal snowfall averages less than 20”? Yikes! Glad I wasn’t a part of that!
The fact that the last two winters have produced over 20” of snow is truly a blessing.
Math23x7- Wx Statistician Guru
- Posts : 2379
Reputation : 68
Join date : 2013-01-08
Re: Weather Statistics Thread
![]() by CPcantmeasuresnow Sun Feb 26, 2017 10:27 am
by CPcantmeasuresnow Sun Feb 26, 2017 10:27 am
Also keep in mind the normal temperatures for this date in February are already up 6 degrees from the normal January averages, yet February is our snowiest month.
NYC.......................44/31
LI/Islip...................42/27
Bridgeport CT.........42/27
HV/Poughkeepsie....42/20
Binghamton...........35/19
Albany...................37/20
Hartford CT............41/23
NE PA/Scranton......39/22
Newark NJ..............45/29
CNJ/Trenton...........45/27
SNJ/Atlantic City.....47/28
CPcantmeasuresnow- Wx Statistician Guru
- Posts : 7274
Reputation : 230
Join date : 2013-01-07
Age : 103
Location : Eastern Orange County, NY
Re: Weather Statistics Thread
![]() by Math23x7 Sun Feb 26, 2017 11:05 pm
by Math23x7 Sun Feb 26, 2017 11:05 pm
First, here are the 1981-2010 monthly and annual averages:
Jan: 32.6
Feb: 35.3
Mar: 42.5
Apr: 53.0
May: 62.4
Jun: 71.5
Jul: 76.5
Aug: 75.2
Sep: 68.0
Oct: 56.9
Nov: 47.7
Dec: 37.5
Ann: 55.0
Now, here the monthly and annual averages relative to 1871 to 1900, which I calculated through Excel:
Jan: 30.0
Feb: 29.4
Mar: 36.7
Apr: 48.4
May: 60.8
Jun: 70.5
Jul: 75.0
Aug: 73.3
Sep: 66.5
Oct: 55.1
Nov: 43.6
Dec: 34.1
Ann: 51.9
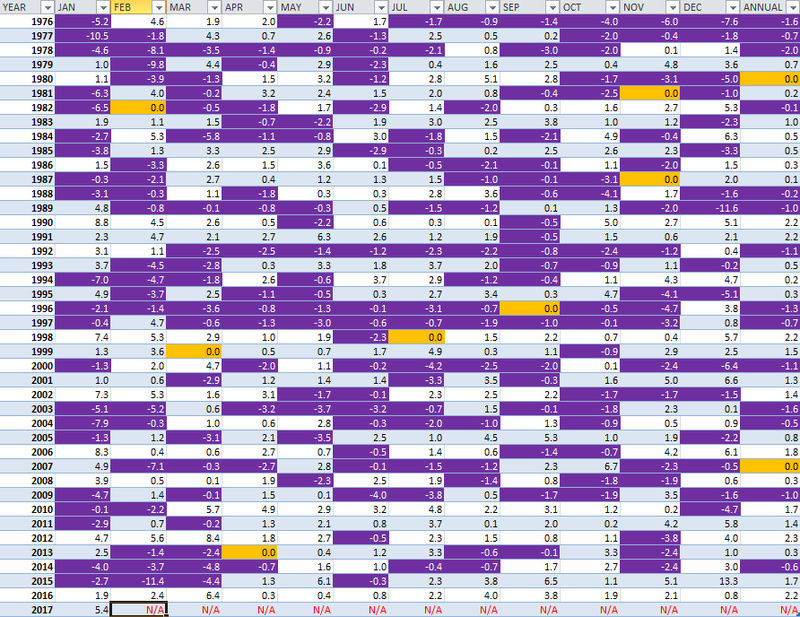
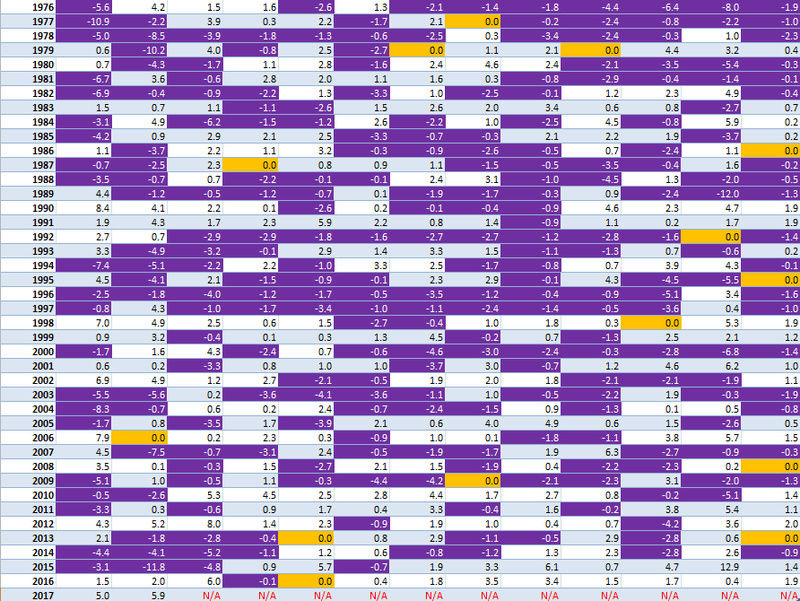
I have created two Excel sheet, one featuring monthly anomalies relative to 1981-2010 and the other featuring anomalies relative to 1871-1900. Since there is not much room in storage for me to put it up, I am posting snapshots of the anomalies going back to 1976. Note that purple cells are below average, and orange cells are average.
First, the chart relative to 1981-2010:
And now for the chart relative to 1871-1900:
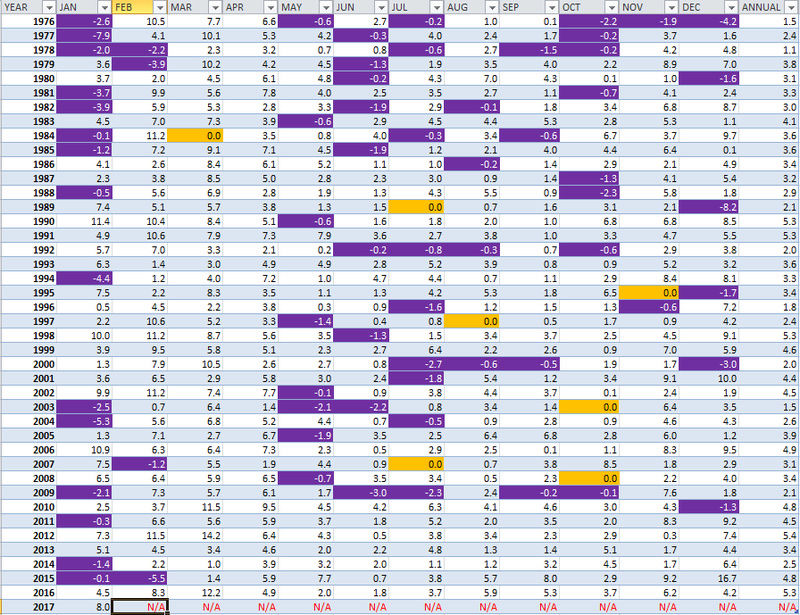
While not featured, the last Annual Average to be normal relative to 1871-1900 was 1940 and the last to be below the 1871-1900 average was 1926. And take a look at December 2015 relative to 1871-1900: 16.7 degrees above average...
I don't think anyone can dispute the fact that we're warmer now than during the late 19th century....
Math23x7- Wx Statistician Guru
- Posts : 2379
Reputation : 68
Join date : 2013-01-08
Re: Weather Statistics Thread
![]() by Frank_Wx Mon Feb 27, 2017 8:07 am
by Frank_Wx Mon Feb 27, 2017 8:07 am
_________________
_______________________________________________________________________________________________________
CLICK HERE to view NJ Strong Snowstorm Classifications
Frank_Wx- Godzilla Seeker
- Posts : 21305
Reputation : 328
Join date : 2013-01-05
Age : 31
Location : Jersey City, NJ -
Re: Weather Statistics Thread
![]() by CPcantmeasuresnow Mon Feb 27, 2017 9:17 am
by CPcantmeasuresnow Mon Feb 27, 2017 9:17 am
Math23x7 wrote:I know this will plunge into a depressing post, but I think I will put this in to broaden the perspective of what normal is.
First, here are the 1981-2010 monthly and annual averages:
Jan: 32.6
Feb: 35.3
Mar: 42.5
Apr: 53.0
May: 62.4
Jun: 71.5
Jul: 76.5
Aug: 75.2
Sep: 68.0
Oct: 56.9
Nov: 47.7
Dec: 37.5
Ann: 55.0
Now, here the monthly and annual averages relative to 1871 to 1900, which I calculated through Excel:
Jan: 30.0
Feb: 29.4
Mar: 36.7
Apr: 48.4
May: 60.8
Jun: 70.5
Jul: 75.0
Aug: 73.3
Sep: 66.5
Oct: 55.1
Nov: 43.6
Dec: 34.1
Ann: 51.9
I have created two Excel sheet, one featuring monthly anomalies relative to 1981-2010 and the other featuring anomalies relative to 1871-1900. Since there is not much room in storage for me to put it up, I am posting snapshots of the anomalies going back to 1976. Note that purple cells are below average, and orange cells are average.
First, the chart relative to 1981-2010:
And now for the chart relative to 1871-1900:
While not featured, the last Annual Average to be normal relative to 1871-1900 was 1940 and the last to be below the 1871-1900 average was 1926. And take a look at December 2015 relative to 1871-1900: 16.7 degrees above average...
I don't think anyone can dispute the fact that we're warmer now than during the late 19th century....
Mike:
Very interesting, all stuff we suspected but the extent of the warming is alarming when you see it in black and white, or even purple.
One of the main things I found fascinating in your data is the average temperature in January in NYC during the 30 year period of 1871-1900 was 30.0 and February was actually colder at 29.4. Contrast that to the last 30 year period 1981-2010 where January was 32.6 and February is actually higher by almost 3 degrees at 35.3. The contrast for March is even more stark, 36.7 then vs. 42.5 now, ALMOST 6 DEGREES HIGHER. The average temperature in March back then was 1 degree or so different than the current February average, smh.
My theory to explain part of this would be during the periods when January's were actually consistently cold in NYC ocean temperatures were consistently lower probably below freezing in most seasons (remember salt water doesn't freeze until it reaches approximately 28-29 degrees) with surrounding sea ice at times that kept February as cold or colder than January. Of course after a January and February of average temperatures below 30 by March with the surrounding waters probably in the 28.5-31 degree range the contrast in March was even more extreme.
The great thing about then was the snow actually stuck around as opposed to recently when NYC and shore areas can barely hold a snow cover for more than a week. Definitely the golden age of weather for people like me.
CPcantmeasuresnow- Wx Statistician Guru
- Posts : 7274
Reputation : 230
Join date : 2013-01-07
Age : 103
Location : Eastern Orange County, NY
Re: Weather Statistics Thread
![]() by docstox12 Mon Feb 27, 2017 10:13 am
by docstox12 Mon Feb 27, 2017 10:13 am
Math23x7 wrote:I know this will plunge into a depressing post, but I think I will put this in to broaden the perspective of what normal is.
First, here are the 1981-2010 monthly and annual averages:
Jan: 32.6
Feb: 35.3
Mar: 42.5
Apr: 53.0
May: 62.4
Jun: 71.5
Jul: 76.5
Aug: 75.2
Sep: 68.0
Oct: 56.9
Nov: 47.7
Dec: 37.5
Ann: 55.0
Now, here the monthly and annual averages relative to 1871 to 1900, which I calculated through Excel:
Jan: 30.0
Feb: 29.4
Mar: 36.7
Apr: 48.4
May: 60.8
Jun: 70.5
Jul: 75.0
Aug: 73.3
Sep: 66.5
Oct: 55.1
Nov: 43.6
Dec: 34.1
Ann: 51.9
I have created two Excel sheet, one featuring monthly anomalies relative to 1981-2010 and the other featuring anomalies relative to 1871-1900. Since there is not much room in storage for me to put it up, I am posting snapshots of the anomalies going back to 1976. Note that purple cells are below average, and orange cells are average.
First, the chart relative to 1981-2010:
And now for the chart relative to 1871-1900:
While not featured, the last Annual Average to be normal relative to 1871-1900 was 1940 and the last to be below the 1871-1900 average was 1926. And take a look at December 2015 relative to 1871-1900: 16.7 degrees above average...
I don't think anyone can dispute the fact that we're warmer now than during the late 19th century....
Funny thing, the May and Junes and Sept and Oct of these charts are not that far off.A bit warmer, yes, but not as extreme as the other months.What's with that, I wonder?
docstox12- Wx Statistician Guru
- Posts : 8507
Reputation : 222
Join date : 2013-01-07
Age : 73
Location : Monroe NY
Re: Weather Statistics Thread
![]() by CPcantmeasuresnow Mon Feb 27, 2017 2:33 pm
by CPcantmeasuresnow Mon Feb 27, 2017 2:33 pm
Frank made a good point about the 1800's on the other thread. Can you compare the averages from 1901-1980 against our current 1981- 2010 averages. From any data I've seen it was around 1980 that the acceleration in average temperatures began. It won't be as extreme as against the 1800's but I still feel it would be significant.
Also can you post the Excel workbook with the temperature data so anyone can access it. I'd love to play around with that for a bit.
Thanks
CPcantmeasuresnow- Wx Statistician Guru
- Posts : 7274
Reputation : 230
Join date : 2013-01-07
Age : 103
Location : Eastern Orange County, NY
Re: Weather Statistics Thread
![]() by rb924119 Mon Feb 27, 2017 3:41 pm
by rb924119 Mon Feb 27, 2017 3:41 pm
My response when asked about the frequency of such anomalies:
The frequency was relatively unchanged actually, if by "frequency of anomalies" you are including both warm and cold anomalies. If you are only referencing warm anomalies, then yes, those are occurring more frequently than in the past. However, there were frequently more cold anomalies occurring in the past versus warm. So, this study just showed to me that there has only been a shift in the sign of the anomalies, and not a substantial difference in the actual frequency of anomalous events.
Follow-up question by a third party:
This seems like a pretty important point- that more anomalies are warm (so warm-signed anomalies are happening more frequently even if the total number of anomalies is largely the same). Since you asked for questions- What statistical test did you use to identify significance? Also what do you mean by not a substantial difference? One anomalous event per climatology period? Two? It sounds like you used the base climatology period of 1981-2010 to define the anomalies but what time period(s) did you look at to count the frequency of events?
My response to third party:
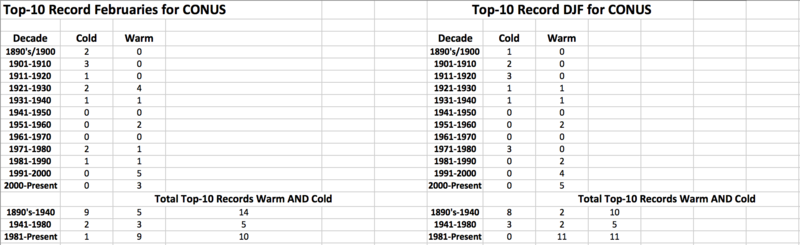
Ok, so the statistical test I used (again) was the same comparison technique. However, even though it doesn't provide actual numerical values, you can clearly tell based on the scope of the anomalies. To answer your questions, I actually went back and broke the numbers down for the data used in my Top-10 years (seen below):
As you can see, I broke it up by anomaly type and decade, and then summed each anomaly type through roughly equal climatological periods (1890's-1940, 1941-1980, 1981-Present). I picked this distribution because seeing as though the data only went through February of 2016, and the data set only started at 1895, the discrepancy of starting midway through the 1890's and ending midway through the 2010's essentially zeroed out. So, in looking at those pieces of data, you can clearly see the inverse relationship between "Cold" and "Warm" Februaries throughout the three climatological periods, with the middle period essentially balancing out (as would be expected in an ideal case with equal time of change occurring on either side of that period). I then summed up the combined number of record Februaries, both "Cold" and "Warm" to demonstrate the frequency of such anomalous events during each climatological period. As you can clearly see, there were actually 29% MORE total anomalous Februaries in the first climatological period (1890's-1940) than our current climatological period of (1981-Present), with a substantial number of colder Februaries occurring more than now, and vice-versa with warm ones, as was stated above.
I also analyzed the same breakdown of Meteorological Winter seasons (DJF), as can also be seen below. Again, the inverse relationship described between the decrease in "Cold" anomalies and increase in "Warm" anomalies with time is easily seen, as is the expected equivalence of both occurrences during the middle climatological period (1941-1980). However, when you look at the relationship of the summed values of both "Cold" and "Warm" seasonal anomalies, there is a difference of only one season, or 9% MORE total anomalous Meteorological Winters, between the first climatological period (1890's-1940) and the current period (1981-Present).
So, to answer your question of what I deemed to be "statistically significant", I would deem the 29% more anomalous Februaries during the first climatological period to be "statistically significant", as that is a substantial difference supported by a vast difference in the monthly counts. However, I do not deem the 9% increase from the first climatological period to the current as "statistically significant" because it is a difference of only one season between the two periods. To be clear, BOTH parts of this are working with a highly limited data set with respect to temporal scale, so to definitively say that either is or is not "statistically significant" with any degree of certainty is a stretch in my opinion, but given relatively equal sized data sets, the former seems to be somewhat more "conclusive" and "statistically significant" than the latter, in that we are actually seeing fewer anomalous Februaries during this period than the first, but essentially little change in Meteorological Winter seasons on the whole.
Keep in mind also, that this analysis DID NOT include any Februaries or Meteorological Winter seasons where the CONUS was divided between "Cold" and "Warm" anomalies, as for the whole, they would largely come out to be a visible "wash", which is why I only focused on the Top-10 for both categories (where there was a clear domination of one sign or the other, thus, a "more anomalous" event in my opinion). However, regional changes across the CONUS could vary from the results seen here, which is a limitation of this aspect of the study. However, even those seasons where the CONUS experienced opposing areas where both "Cold" and "Warm" anomalies occurred simultaneously for February and DJF, those Februaries/seasons also appeared to be largely roughly equivalent throughout the three climatological periods defined above.
Take that as you will haha
rb924119- Meteorologist

- Posts : 6890
Reputation : 194
Join date : 2013-02-06
Age : 32
Location : Greentown, Pa
Re: Weather Statistics Thread
![]() by Dtone Wed Mar 01, 2017 9:40 am
by Dtone Wed Mar 01, 2017 9:40 am
Avg temp, departure, and rounded avg high/low for the month.
Note that the avg low temp is above freezing for all NYC stations and Newark.
NYC 41.6, +6.3, 49/35
LGA 42.8, +7.5, 50/36
JFK 40.3, +5.5, 48/33
EWR 41.6, +7.0, 50/33
ISP 37.8, +5.0, 46/29
HPN 37.6, +6.7, 46/29
BDP 38.4, +6.0, 46/31
Actually for every month of meteorological winter the avg low temp in Central Park has been above freezing.
Dec: 44/33
Jan: 43/33
Feb 49/35 (Hasn't been at or below freezing since Feb 17th)
I counted 35 days during met winter with low temps at/below freezing. (Dec: 11, Jan: 12, Feb: 12) I believe that's close to a record.
Overall we had a slightly above normal Dec, then it never got any colder than that, eventually much warmer by mid Feb.
Dtone- Wx Statistician Guru
- Posts : 1738
Reputation : 9
Join date : 2013-08-26
Location : Bronx, NY
Re: Weather Statistics Thread
![]() by Math23x7 Wed Mar 01, 2017 10:05 pm
by Math23x7 Wed Mar 01, 2017 10:05 pm
1996: Ash Wednesday (2/21): 52/46; Easter (4/7): 42/34
2000: Ash Wednesday (3/8 ): 62/42; Easter (4/23): 49/44
2005: Ash Wednesday (2/9): 54/46; Easter (3/27): 49/38
2007: Ash Wednesday (2/21): 49/39; Easter (4/8 ): 41/30
2008: Ash Wednesday (2/6): 68/41; Easter (3/23): 48/30
This is a relevant discussion now because today (Ash Wednesday), it hit 70 at CPK and the high/low is likely 70/54. Easter is 4/16 where the normal high/low is 62/45. So unless it is over eight degrees above average on that day, this will be one of those years that I mentioned above.
Math23x7- Wx Statistician Guru
- Posts : 2379
Reputation : 68
Join date : 2013-01-08
Re: Weather Statistics Thread
![]() by Math23x7 Fri Mar 03, 2017 11:28 pm
by Math23x7 Fri Mar 03, 2017 11:28 pm
1) April. When I looked at the April column on Excel, I realized that for some reason, it took the average from 1870-99 as opposed to 1871-1900. As a result, the April average during this time was not 48.4, it was actually 48.6.
2) February. This was a result of a faulty formula I put in. You see, unlike the other 11 months, which have the same amount of days every year, February has 28 or 29 days depending on the year. So I put extra weight on the leap years. This morning, I took another look at the temperatures, finding it unusual that February would be colder than January back then, so I asked myself how many years it occurred. I found that in that 1871-1900 span, only nine years did that occur. I then took the average of the difference and found that the January temperature was lower than that of February. The way I had calculated the average was by multiplying the average of each February by either 28 or 29 days, depending on the year, taking the average of the 30 products and then dividing by the average length of the month based on how many leap years there were. I had done it as 28+(0.25*#of leap years). With seven leap years (remember, 1900 was not a leap year), the average would be divided by 29.75. This is wrong! The correct way to do it is 28+(# of leap years/30), so that the average is divided by ~28.23. In Layman's terms, the 1871-1900 February average was NOT 29.4, it was actually 31.0. This means that February was NOT colder than January on average as my previous post indicated.
3) Annual. After realize the February error I made, I knew the same problem had to be shown with the Annual average, and sure enough, it did. Replace 28 with 365 and the issue was the same. After making the correction, the Annual 1871-1900 average was not 51.9, it was actually 52.1.
With these three errors, the temperature anomalies do come down slightly. It does not, however, change the fact that it was much colder then as it is now.
Now, something else I asked myself: Were the 1981-2010 temperature anomalies issued by the NWS the same as the calculated averages that would run through by Excel file? As it turns out, the 1981-2010 averages I calculated were actually slightly HIGHER than those the NWS put out. As I will point out later, this would mean that there was actually a month below average by these standards, albeit slightly (April 2016)
So here is the revised set of 1871-1900 averages:
Jan: 30.0
Feb: 31.0
Mar: 36.7
Apr: 48.6
May: 60.8
Jun: 70.5
Jul: 75.0
Aug: 73.3
Sep: 66.5
Oct: 55.1
Nov: 43.6
Dec: 34.1
Ann: 52.1
Now, here is the 1981-2010 set of averages if it were based on the Calculations I put in:
Jan: 33.0
Feb: 35.7
Mar: 42.9
Apr: 53.4
May: 62.8
Jun: 71.9
Jul: 76.9
Aug: 75.7
Sep: 68.4
Oct: 57.3
Nov: 48.1
Dec: 37.9
Ann: 55.3
Here is the revised 1871-1900 chart:
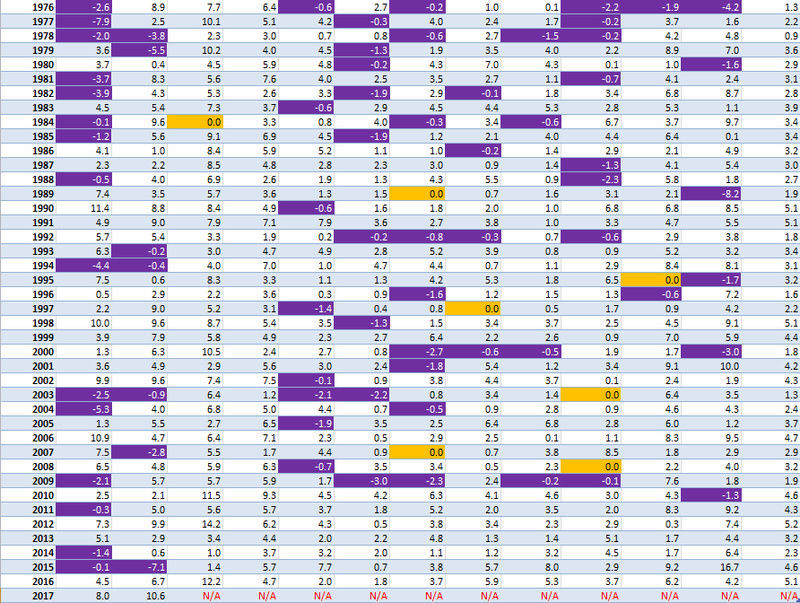
And here is a calculated 1981-2010 chart based on what I posted above:
The calculations from NWS's 1981-2010 averages are the same as in my post from Sunday night, only add February to make it +6.6.
To revise my previous post, the last below average year relative to 1871-1900 was actually 1940, not 1926.
I apologize for the errors that I posted a few nights ago.
Math23x7- Wx Statistician Guru
- Posts : 2379
Reputation : 68
Join date : 2013-01-08
Re: Weather Statistics Thread
![]() by CPcantmeasuresnow Fri Mar 10, 2017 9:56 pm
by CPcantmeasuresnow Fri Mar 10, 2017 9:56 pm
The average March is 42.5 so if March finishes just 1.0 degree below normal it will end up being a colder month than February. I don't have the data to check it but I doubt that has happened many times if any since records were kept.
CPcantmeasuresnow- Wx Statistician Guru
- Posts : 7274
Reputation : 230
Join date : 2013-01-07
Age : 103
Location : Eastern Orange County, NY
Re: Weather Statistics Thread
![]() by Math23x7 Fri Mar 10, 2017 10:18 pm
by Math23x7 Fri Mar 10, 2017 10:18 pm
CPcantmeasuresnow wrote:February ended up being the warmest in history with an average temperature of 41.6 in NYC making it 20 months in a row of above normal temperatures. If March can finally end the streak and end the month slightly below normal it could end up being a colder month on average than February was
The average March is 42.5 so if March finishes just 1.0 degree below normal it will end up being a colder month than February. I don't have the data to check it but I doubt that has happened many times if any since records were kept.
It has happened six times since records have been kept:
1877
1880
1890
1891
1960
1984
Math23x7- Wx Statistician Guru
- Posts : 2379
Reputation : 68
Join date : 2013-01-08
Re: Weather Statistics Thread
![]() by CPcantmeasuresnow Fri Mar 10, 2017 10:36 pm
by CPcantmeasuresnow Fri Mar 10, 2017 10:36 pm
Math23x7 wrote:CPcantmeasuresnow wrote:February ended up being the warmest in history with an average temperature of 41.6 in NYC making it 20 months in a row of above normal temperatures. If March can finally end the streak and end the month slightly below normal it could end up being a colder month on average than February was
The average March is 42.5 so if March finishes just 1.0 degree below normal it will end up being a colder month than February. I don't have the data to check it but I doubt that has happened many times if any since records were kept.
It has happened six times since records have been kept:
1877
1880
1890
1891
1960
1984
Thanks Mike, I figured you'd have the data.
CPcantmeasuresnow- Wx Statistician Guru
- Posts : 7274
Reputation : 230
Join date : 2013-01-07
Age : 103
Location : Eastern Orange County, NY
Re: Weather Statistics Thread
![]() by CPcantmeasuresnow Sun Mar 12, 2017 10:19 pm
by CPcantmeasuresnow Sun Mar 12, 2017 10:19 pm
20 Largest March 1 thru April
Snowstorms NYC
Rank.Amount..Date
1…….21.0……..March 12-14, 1888
2…….18.1……..March 7-8, 1941
3…….14.5….....March 3-4, 1960
4…….14.5….....March 1-2, 1914
5…….12.0……..March 15-16, 1896
6…….11.8…..…March 19-20, 1958
7…….11.6……..March 18-19, 1956
8…….10.6….....March 13-14, 1993
9…….10.2……..April 3-4, 1915
10….10.0…..….April 13, 1875
11….10.0……...March 2, 1896
12…...9.6……...April 6, 1982
13…...9.4……...Feb,28-March 1, 1949
14…...9.0……...March 22, 1967
15…...9.0……...March 4, 1893
16…...8.6……...March 5, 1981
17…...8.5…..….April 1, 1924
18…...8.3……...March 1-2, 2009
19…...8.0……...March 17-18, 1892
20…...7.7……...March 6-7, 1915
Last edited by CPcantmeasuresnow on Sun Mar 12, 2017 11:17 pm; edited 1 time in total
CPcantmeasuresnow- Wx Statistician Guru
- Posts : 7274
Reputation : 230
Join date : 2013-01-07
Age : 103
Location : Eastern Orange County, NY
Re: Weather Statistics Thread
![]() by Math23x7 Sun Mar 12, 2017 11:13 pm
by Math23x7 Sun Mar 12, 2017 11:13 pm
CPcantmeasuresnow wrote:With hopefully somewhat of a historic March snowstorm coming up Tuesday our friends at TWC have been putting out some very misleading data regarding the greatest all time snow events in NYC from March first forward. Below is the real list for March 1 forward by rank.
20 Largest March 1 thru April
Snowstorms NYC
Rank.Amount..Date
1…….21.0……..March 12-14, 1888
2…….18.1……..March 7-8, 1941
3…….14.5….....March 3-4, 1960
4…….14.5….....March 1-2, 1914
5…….12.0……..March 15-16, 1896
6…….11.8…..…March 19-20, 1958
7…….11.6……..March 18-19, 1956
8…….10.6….....March 13-14, 1993
9…….10.2……..April 3-4, 1915
10….10.0…..….April 13, 1875
11….10.0……...March 2, 1896
12…...9.6……...April 6, 1982
13…...9.4……...Feb,28-March 1, 1949
14…...9.0……...March 22, 1967
15…...9.0……...March 4, 1893
16…...8.6……...March 5, 1981
17…...8.5…..….April 1, 1924
18…...8.3……...March 1-2, 20009
19…...8.0……...March 17-18, 1892
20…...7.7……...March 6-7, 1915
We all know that the 21" from 1888 should have been ~30".
Also, I think for #18 you meant 2009. Otherwise, your prediction skills 18,000 years out are amazing!
Math23x7- Wx Statistician Guru
- Posts : 2379
Reputation : 68
Join date : 2013-01-08
Re: Weather Statistics Thread
![]() by CPcantmeasuresnow Sun Mar 12, 2017 11:17 pm
by CPcantmeasuresnow Sun Mar 12, 2017 11:17 pm
Math23x7 wrote:CPcantmeasuresnow wrote:With hopefully somewhat of a historic March snowstorm coming up Tuesday our friends at TWC have been putting out some very misleading data regarding the greatest all time snow events in NYC from March first forward. Below is the real list for March 1 forward by rank.
20 Largest March 1 thru April
Snowstorms NYC
Rank.Amount..Date
1…….21.0……..March 12-14, 1888
2…….18.1……..March 7-8, 1941
3…….14.5….....March 3-4, 1960
4…….14.5….....March 1-2, 1914
5…….12.0……..March 15-16, 1896
6…….11.8…..…March 19-20, 1958
7…….11.6……..March 18-19, 1956
8…….10.6….....March 13-14, 1993
9…….10.2……..April 3-4, 1915
10….10.0…..….April 13, 1875
11….10.0……...March 2, 1896
12…...9.6……...April 6, 1982
13…...9.4……...Feb,28-March 1, 1949
14…...9.0……...March 22, 1967
15…...9.0……...March 4, 1893
16…...8.6……...March 5, 1981
17…...8.5…..….April 1, 1924
18…...8.3……...March 1-2, 20009
19…...8.0……...March 17-18, 1892
20…...7.7……...March 6-7, 1915
We all know that the 21" from 1888 should have been ~30".
Also, I think for #18 you meant 2009. Otherwise, your prediction skills 18,000 years out are amazing!
 To my predictive skills in 20009 Mike.
And after studying it several times I believe the Blizzard of 1888 was about 36 inches in Manhattan.
CPcantmeasuresnow- Wx Statistician Guru
- Posts : 7274
Reputation : 230
Join date : 2013-01-07
Age : 103
Location : Eastern Orange County, NY
Re: Weather Statistics Thread
![]() by Math23x7 Tue Mar 14, 2017 2:33 pm
by Math23x7 Tue Mar 14, 2017 2:33 pm
Math23x7- Wx Statistician Guru
- Posts : 2379
Reputation : 68
Join date : 2013-01-08
Re: Weather Statistics Thread
![]() by CPcantmeasuresnow Tue Mar 14, 2017 7:19 pm
by CPcantmeasuresnow Tue Mar 14, 2017 7:19 pm
Last edited by CPcantmeasuresnow on Tue Mar 14, 2017 9:30 pm; edited 3 times in total
CPcantmeasuresnow- Wx Statistician Guru
- Posts : 7274
Reputation : 230
Join date : 2013-01-07
Age : 103
Location : Eastern Orange County, NY
Re: Weather Statistics Thread
![]() by Math23x7 Tue Mar 14, 2017 9:06 pm
by Math23x7 Tue Mar 14, 2017 9:06 pm
Of course, I would take 1968-69 over 2016-17 in a heartbeat. Why? The February 1969 snowstorm which gave 22" for Bellerose, which was its biggest snowstorm on record until January 23rd, 2016's 25"
Math23x7- Wx Statistician Guru
- Posts : 2379
Reputation : 68
Join date : 2013-01-08
Page 3 of 14 • 1, 2, 3, 4 ... 8 ... 14 ![]()
|
|
|