A Discussion About The Relationship B/W the Stratosphere and Troposphere
4 posters
 A Discussion About The Relationship B/W the Stratosphere and Troposphere
rb924119 wrote:sroc4 wrote:rb924119 wrote:sroc4 wrote:rb924119 wrote:The reversal of the Stratospheric winds is irrelevant, Scot; it’s a byproduct of the warming. The warming is what effects the actual changes in the atmosphere, not the wind reversal.And with the warming where it is, you’re going to have a “shadow” vortex develop equatorward of it, relative to averages
That’s my exact point Ray. Esp when there is no reversal the position of the SPV is critical. Up through now it’s position has been poorly oriented for most of NA.
Ignore the reversal, it’s irrelevant to the sensible weather. The only thing it satisfies is tue textbook definition. The evolution of the warming is what matters. The warming in the Stratosphere that you currently see on maps has been ongoing since the first week of December. Those fluxes are going to start impacting the Troposphere next week. So to say that the state of the Stra today is effecting the weather today isn’t fair. You’d have to look at November to see how the Strat evolved in order to make the argument you’re making. That’s my point.
I couldnt disagree more. I think at times, major changes to the strat can take time to see the result of the surface yes. But I also think while it may not be directly influencing the trop they are always linked. Under certain conditions more so, and others less so. Despite a term we want to call a tropopause, there is no definite large scale piece of cellophane separating the two. So under relatively stable conditions, or minor changes to the strat you can see direct correlation between where the lowest heights of the SPV live and the TPV live. This can be demonstrated over and over. A change at the strat isnt locked to a 3-6 week lag time when they have been coupled as they have been between 10mb down through 100, and consequently the troposphere. But as the forecast shows the 10mb nd 50mb SPV is set to de couple as a result of a second even stronger wave of warming begining at the top10m and eventually translating down.
I think the warming throughout Dec was such that it weakened the SPV some but actyed more to push it, rather than to strongly weaken it. There wasnt enough weakening and warming of the vortex itself, just the surrounding ridging acted as an expanding balloon that pushed the vortex over to the wrong side of the hemi. And because there is some link and has been since the fall the 500mb pattern responded accordingly.
.....back to our regularly scheduled programming. Sorry, folks, I didn't mean to hijack this thread, but again, I felt that my other post was appropriate given the amount of passion in this debate.
Im going to take my response to this piece by piece, Scott.
1. I think at times, major changes to the strat can take time to see the result of the surface yes. But I also think while it may not be directly influencing the trop they are always linked.
To start off, it's widely agreed upon by those who have studied Troposphere-Stratosphere fluxes that the average lag period is approximately one month. I have read this in several papers over the years, though, obviously, the exact amount of lag is dependent upon various factors, most notably the strength and duration of anomalous flux. I have subjectively adapted my own lag time when it comes to forecasting based on a combination of experience, research, and analysis of conditions leading up to each particular event. That's how I come up with my (subjective) time frame of a general 3-6 weeks. For example, this event is taking approximately one month to be expressed. However, I think the follow-up event (happening now) will not take nearly that long as the atmospheric "receptivity" to these fluxes is much higher. Conceptually, think of this first event as the "primer", while the next event (evolving as we speak.....or, type lol) will already have the foundation laid for it to be more quickly reflected in the Troposphere. That's how I look at it. So, conceptually, the follow-up event should end by the first week of January, and I think by Week 3, the results should be evolving in the Troposphere. We will see how this works out.
To your second point, I don't fundamentally disagree with you, but again, I think that you are taking the linkage too directly, and are not properly accounting for the observed and well-demonstrated lag between the two atmospheric levels. And that lag goes both ways. For example, sometimes blocking in the Troposphere can be what causes the Stratospheric vortex disruption, and, in certain orientations (one of which we will be seeing evolve beginning later next week) the flux transport is more efficient than in others (sustained ridging in the NAO and EPO/WPO domains are the most efficient mechanisms for inducing vertical fluxes to the Stratospheric vortex). So, keep this in mind, as this will work in our favor to continue to perturb the Stratospheric vortex, and we should see a THRID warming event as we get toward the end of January and beginning of February, especially with the presence of the easterly QBO, but this one will be induced by the strong blocking in the NAO domain.
2. Despite a term we want to call a tropopause, there is no definite large scale piece of cellophane separating the two.
To this point, ok, no; there isn't a truly impermeable layer separating the two. But don't forget, the Tropopause is a large inversion that separates the Troposphere from the Stratosphere, so, there actually IS a separation between the two. Let me show you something:
Here's a conceptual model of our Troposphere ("T"), Tropopause ("T.P."), and Stratosphere ("S") based on a thermal profile. The black "C" (cold) and "W" (warm) represent the temperature scale, and the red line denotes the general thermal profile throughout the three vertical atmospheric layers. As you can see, the Troposphere cools with height, the Tropopause starts generally isothermal (steady temperature) then warms with height before leveling off again, and then the Stratosphere cools with height again. I think we can both agree that, in the Northern Hemisphere, the wind always blows with cold air on the left, correct? That's why we have westerly jets. In the middle of the Troposphere AND the Stratosphere, this would result in wind going INTO the page (or, in our case, the computer/phone/tablet screen).
Now, take a look at the green circles on the thermal diagram, labeled "1" and "2", and go to the top of the graphic where I zoomed in a little bit. Also notice how I have "C" (cold) and "W" (warm) color coded now. Ok, so in the first circle, you can see that we clearly have colder air sitting beneath warmer air. As a result, we would conceptualize a wind coming OUT of the page (or, in our case, computer/phone/tablet screen), as denoted by the circle with the dot. However, note that the thermal profile reverses in the second circle. Therefore, the wind must also reverse and be going INTO the page (or, in our case, computer/phone/tablet screen), as denoted by the "X" with the dot. This wind reversal signifies that the two levels are, in fact, separate entities, even thought they are not technically "separate". Basically, it's a large scale inversion just like the ones that wreck all of Jman's wind events, or at least a lot of them (lol), since the momentum cannot be transported through it, and the layers "decouple" to a degree. Same thing here.
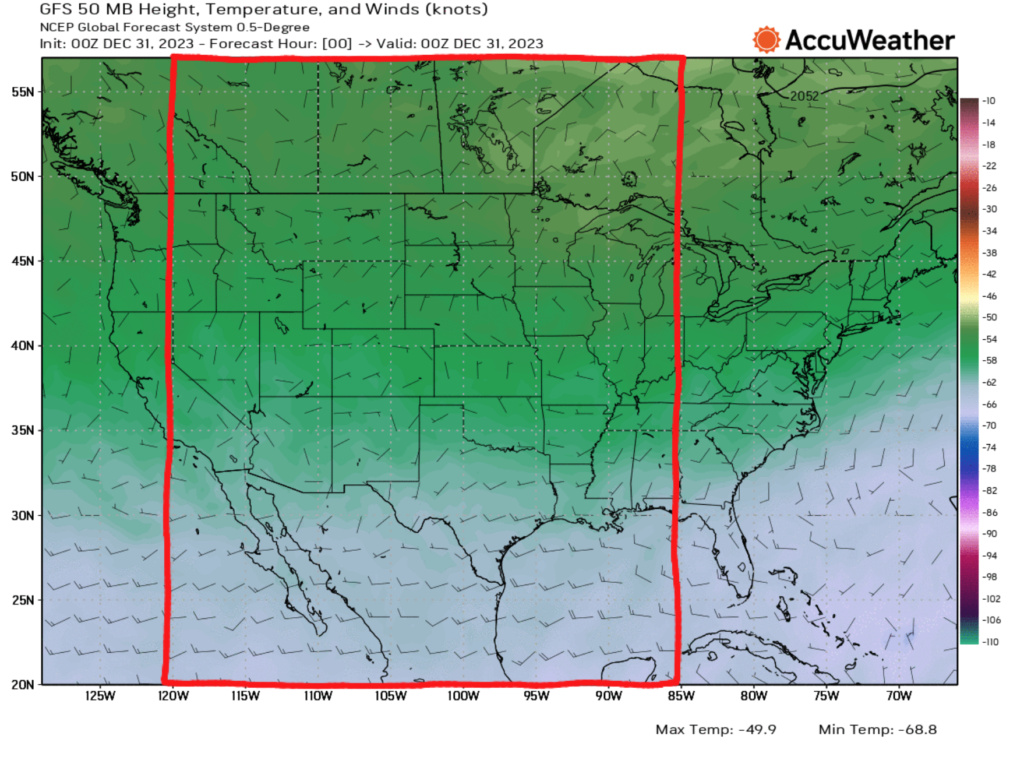
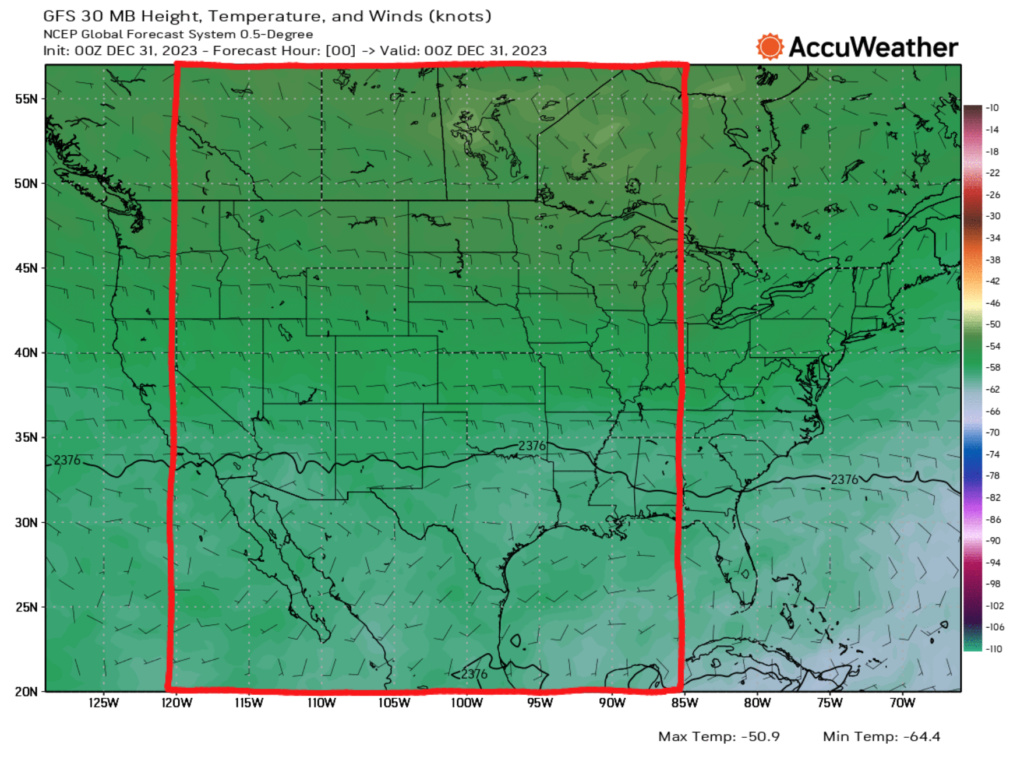
To take this a step further, take a look at the following images taken from the initialization of the GFS Operational at 100 hPa, 70 hPa, 50 hPa, 30 hPa, 20 hPa, and 10 hPa. The black lines denote height, the wind barbs are self explanatory, and the colors are temperature. Pay attention to the wind barbs in the red box in each of the images. Notice how they all start out uniformly westerly/northwesterly at 100 hPa, but then as you look at 70 hPa, 50 hPa, and 30 hPa, there is a clear, albeit much weaker reversal, where the wind goes easterly. Then, the wind starts reversing again at the 20 hPa level, and further at 10 hPa. This helps to show the concept discussed above in real time.
3. So under relatively stable conditions, or minor changes to the strat you can see direct correlation between where the lowest heights of the SPV live and the TPV live.
I do not fundamentally disagree with you here - if there are no fluxes being added into the system, then conceptually, yes, there's no lagged input to account for, so they should look fairly similar in real time.
4. A change at the strat isnt locked to a 3-6 week lag time when they have been coupled as they have been between 10mb down through 100, and consequently the troposphere. But as the forecast shows the 10mb nd 50mb SPV is set to de couple as a result of a second even stronger wave of warming beginning at the top 10mb and eventually translating down.
I touched on this in my first point. It isn't a coupling or decoupling that you're looking at, per se'; it's a lagged effect as the heat flux works its way down (or up).
5. I think the warming throughout Dec was such that it weakened the SPV some but acted more to push it, rather than to strongly weaken it. There wasnt enough weakening and warming of the vortex itself, just the surrounding ridging acted as an expanding balloon that pushed the vortex over to the wrong side of the hemi. And because there is some link and has been since the fall the 500mb pattern responded accordingly.
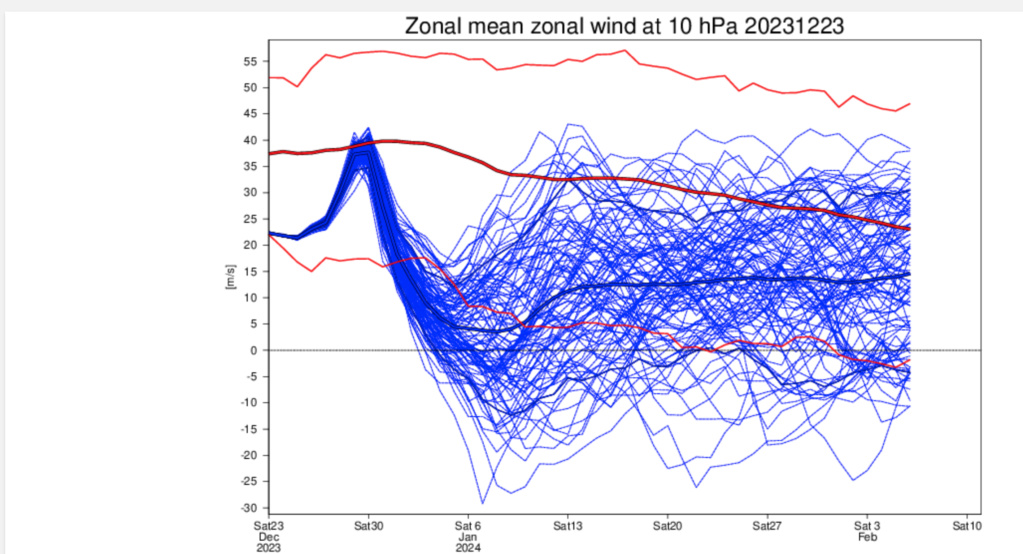
I think our disagreement here is more semantics than anything else. The degree to which we feel that the warming weakened the vortex can be subjective, but we both agree on the same premises - the vortex was weakened to some degree, and it was also shifted equatorward. However, I think there's a reasonable amount of information to say that the Stratospheric vortex has taken a pretty substantial hit. The below is the Euro Ensemble zonal wind forecast initialized at 23rd December. As you can see, the first wave of warming knocked it to the lower red line, which is the 90th percentile (very statistically significant, anomalously weak), and this second warming event will do the same:
And this where I will close out by saying that even though there will likely be no formal reversal, that point is moot, because the reversal is not the cause of what we experience here in the Troposphere; it's a byproduct. The warming itself is what sets the events in motion, because those anomalous fluxes have been working downward over the last few weeks into the troposphere, and now we will start to see the Tropospheric pattern respond.
I hope that all of this made sense, for you and everybody, but if not, let me know and we can take it further
I think this post is just too damn good to not pull from the other thread so that when the discussion is over I can easily archive it in the weather education section of this site for future reference.
Ray this is a phenomenal post and I so appreciate the time, effort, and expertise put into it. To say you have got the wheels turning in my head is an understatement. lol I think this post actually aligns many of our thoughts and ideas rather than disputes opposing claims.
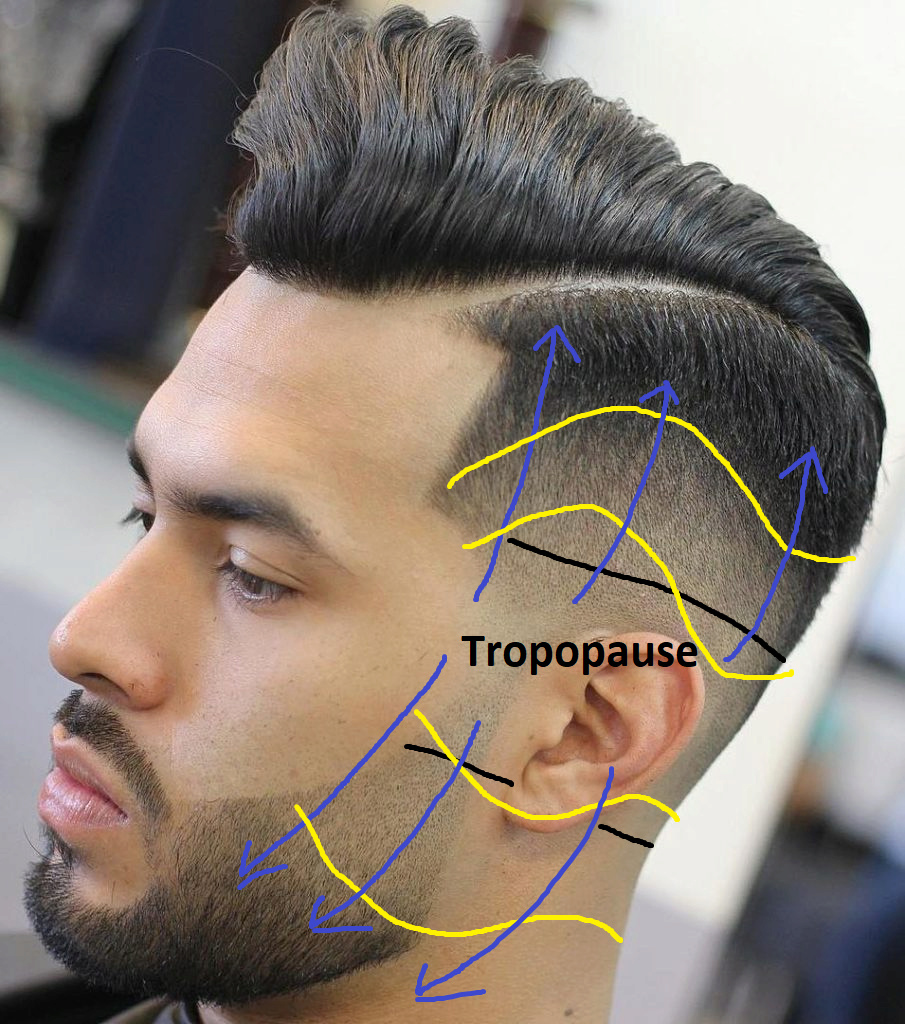
Ill make one comment about the Tropopause. That image you drew out was fantastic and really helped for the visual, but Im sure you would agree its over simplified. Both the lower boundary as well as the upper boundary of the tropopause is not linear, but rather sinusoidal depending on the details of the atmospheric conditions in the troposphere from below as well as the details of the atmospheric conditions in the Stratosphere from above.
To better visualize the temp changes as you approach the tropopause, the inversion layer between troposphere and Stratosphere, think of the changes in temps with altitude like a nice fade to a hair cut where its fades down and up away from or towards the tropopause in a sinusoidal fashion depending on the exact layer of the atmosphere and where you are on the globe geographically. The magnitude of the pressure exerted down from above and up from below, the sum of these vectors, determines what it looks like at any one moment, but as we know this is not a polaroid picture. This is a dynamic process meaning it is in a constant state of flux; ever changing and shifting, with changing temps and pressure from both above and below

I have so much more to say but not the time to say it....to be continued.....
_________________
"In weather and in life, there's no winning and losing; there's only winning and learning."
WINTER 2012/2013 TOTALS 43.65"WINTER 2017/2018 TOTALS 62.85" WINTER 2022/2023 TOTALS 4.9"
WINTER 2013/2014 TOTALS 64.85"WINTER 2018/2019 TOTALS 14.25" WINTER 2023/2024 TOTALS 13.1"
WINTER 2014/2015 TOTALS 71.20"WINTER 2019/2020 TOTALS 6.35"
WINTER 2015/2016 TOTALS 35.00"WINTER 2020/2021 TOTALS 37.75"
WINTER 2016/2017 TOTALS 42.25"WINTER 2021/2022 TOTALS 31.65"

sroc4- Admin

- Posts : 8354
Reputation : 302
Join date : 2013-01-07
Location : Wading River, LI
docstox12 and rb924119 like this post
 Re: A Discussion About The Relationship B/W the Stratosphere and Troposphere
Thank, you, brother, I’m glad that it helped and made sense!
I do agree that my graphic is simplistic, but the overall idea is still applicable. While you do see the atmosphere respond like ripples in a pond, where each layer can ripple like a fluid, it still maintains its stratification. Think of it like a sandwich. Bottom piece of bread is the Troposphere, the “meat” is the Tropopause, and the top piece of bread is the Stratosphere. You can bend the sandwich and contort/perturb it, but the bottom bread (Troposphere) still stays in tact, as does the “meat” (Tropopause) and the top piece of bread (Stratosphere).
Now, there ARE instances where you get what are called tropospheric folds, where there is a DIRECT interaction/transfer of PV between the two levels, but this only occurs in very strong cyclogenesis events. Basically, what happens in this case, is that you end up contracting the Troposphere so much that the Stratosphere is actually drawn in below the Tropopause as well, and then because of the vertical poleward tilt, tropospheric theta/PV surfaces get “advected” back over the top in the warm-sector of the tropospheric cyclone, and actually pinches off the stratospheric PV in the Troposphere.
It’s hard to explain, but if you watch a vertical cross-section of such an event it’s a lot easier to understand. Instead of thinking about advection in a two-dimensional sense (latitude/longitude), it’s advection in three dimensions haha
rb924119- Meteorologist

- Posts : 6928
Reputation : 194
Join date : 2013-02-06
Age : 32
Location : Greentown, Pa
docstox12 likes this post
 Re: A Discussion About The Relationship B/W the Stratosphere and Troposphere
Amazing knowledge displayed by you two gentlemen here on the topic.I will reread the posts again to try and get more out of it but after the first read, I am hungry for a sandwich and realize I need a haircut.Only joking guys, excellent analogies!
Excited to see the above translated into the weather in January!
Excited to see the above translated into the weather in January!

docstox12- Wx Statistician Guru

- Posts : 8530
Reputation : 222
Join date : 2013-01-07
Age : 73
Location : Monroe NY
JT33 likes this post
 Re: A Discussion About The Relationship B/W the Stratosphere and Troposphere
This is great stuff. I, too, need a good sandwich and haircut before I can sit down and properly process all the information. Thank you both for taking the time to add such complete thoughts.
JT33- Posts : 42
Reputation : 0
Join date : 2022-01-25
Location : Piscataway
Permissions in this forum:
You cannot reply to topics in this forum|
|
|

 Home
Home


