
 Search
Stratosphere
3 posters

Stratosphere
![]() by sroc4 Fri Jan 29, 2016 7:21 am
by sroc4 Fri Jan 29, 2016 7:21 am
Hey Frank, or anyone with more knowledge than me, I have some questions. In your convos with Tom when defining a major SSW or to achieve a "full" SSWE you stated "to achieve a full SSW that would involve winds reversing at 10hPa/60N". Does it have to be 60N? The reason I ask this is as I have been following along the Strat forecasts this year I have not really seen what I am looking at in the forecasts now. Please correct me if Im wrong here, but starting by day 2 on the ECMWF forecast it appears as if the zonal winds reverse for about a 4-5day period between 70N-90N. At its peak the reversal appears to take place throughout the entire column from 1hpa-1000hpa on day 6 before quickly recovering. For those who don't have a clue what Im talking about I am looking at the blue colors that come into the upper right hand corner of the images, and begin to extend down as time moves on.


Is this of any significance despite not fitting that definition of 10hpa at 60N?
In addition it looks like for the first time we have the strongest EPV attack at the end of the forecast period(bottom image). That last arrow reaching nearly the top of the image and pointing almost strait up. I remember Tom noting that we want to see that right?.

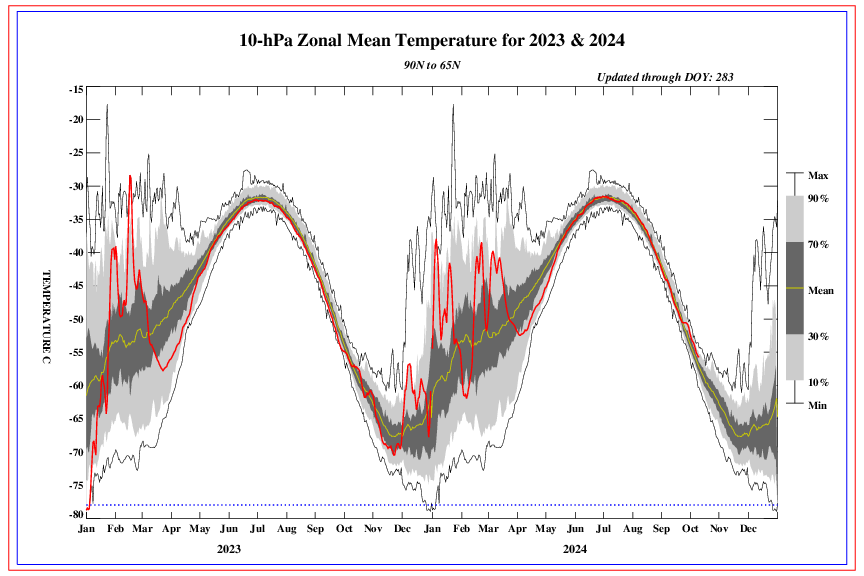
And finally this last image below image reveals how at 10hpa we are in the process of a warming event, however you can see we are still just below the mean.
Is this of any significance despite not fitting that definition of 10hpa at 60N?
In addition it looks like for the first time we have the strongest EPV attack at the end of the forecast period(bottom image). That last arrow reaching nearly the top of the image and pointing almost strait up. I remember Tom noting that we want to see that right?.
And finally this last image below image reveals how at 10hpa we are in the process of a warming event, however you can see we are still just below the mean.
_________________
"In weather and in life, there's no winning and losing; there's only winning and learning."
WINTER 2012/2013 TOTALS 43.65"WINTER 2017/2018 TOTALS 62.85" WINTER 2022/2023 TOTALS 4.9"
WINTER 2013/2014 TOTALS 64.85"WINTER 2018/2019 TOTALS 14.25" WINTER 2023/2024 TOTALS 13.1"
WINTER 2014/2015 TOTALS 71.20"WINTER 2019/2020 TOTALS 6.35"
WINTER 2015/2016 TOTALS 35.00"WINTER 2020/2021 TOTALS 37.75"
WINTER 2016/2017 TOTALS 42.25"WINTER 2021/2022 TOTALS 31.65"
sroc4- Admin

- Posts : 8331
Reputation : 301
Join date : 2013-01-07
Location : Wading River, LI
Re: Stratosphere
![]() by Frank_Wx Sat Jan 30, 2016 9:54 am
by Frank_Wx Sat Jan 30, 2016 9:54 am
Hi Scott,
A full definition of a SSW can be read here. This definition is common across most literatures I read about SSW.
https://docs.google.com/viewer?a=v&pid=sites&srcid=ZGVmYXVsdGRvbWFpbnxzdHJhdG9zcGhlcmljd2FybWluZ3N8Z3g6MjJkZmUzY2M3ZmVkYjhhMA
The easiest way to think about a SSW is warming has to propagate across all levels of the Stratosphere. You can't only have warming go from 100hPa-50 hPa (lower to mid Stratosphere) and call that SSW. Temperatures need to warm all the way from the lower to upper Stratosphere to ensure its permanent and will lead to drastic changes at 500mb in the Troposphere.
In the u-wind images you posted the only significance there is the PV may be weakening but by definition that is not a SSW. In the last box of the 2nd image, the more poleward the arrows (direction) and higher up along the axis (magnitude) the more severe the wave forcing is. Models in the LR have shown PV splits or displacement but once they get to mid-range they go back to showing a strong PV or temporary displacement.
_________________
_______________________________________________________________________________________________________
CLICK HERE to view NJ Strong Snowstorm Classifications

Frank_Wx- Godzilla Seeker
- Posts : 21305
Reputation : 328
Join date : 2013-01-05
Age : 31
Location : Jersey City, NJ -

Re: Stratosphere
![]() by sroc4 Sat Jan 30, 2016 9:59 am
by sroc4 Sat Jan 30, 2016 9:59 am
Thanks Frank
_________________
"In weather and in life, there's no winning and losing; there's only winning and learning."
WINTER 2012/2013 TOTALS 43.65"WINTER 2017/2018 TOTALS 62.85" WINTER 2022/2023 TOTALS 4.9"
WINTER 2013/2014 TOTALS 64.85"WINTER 2018/2019 TOTALS 14.25" WINTER 2023/2024 TOTALS 13.1"
WINTER 2014/2015 TOTALS 71.20"WINTER 2019/2020 TOTALS 6.35"
WINTER 2015/2016 TOTALS 35.00"WINTER 2020/2021 TOTALS 37.75"
WINTER 2016/2017 TOTALS 42.25"WINTER 2021/2022 TOTALS 31.65"
sroc4- Admin
- Posts : 8331
Reputation : 301
Join date : 2013-01-07
Location : Wading River, LI
Re: Stratosphere
![]() by amugs Thu Feb 04, 2016 1:08 pm
by amugs Thu Feb 04, 2016 1:08 pm
ISOTHERM POSTING ABOUT THE STRATOSPHERE - AWESOME NEWS
Still having a difficult time buying into the total collapse of the Pacific pattern progged by the ECMWF ensembles for mid February. Latest bias corrected ECMWF MJO guidance continues to weaken the amplitude of the wave such that it's barely coherent propagating through octants 4-5-6. Additionally, the upper divergence signal in the central tropical Pacific will be much more significant than the IO/Indonesia convection, which leads me to believe the lower than normal heights will not shift into AK/British Columbian coast for D 10-15. Furthermore, the evolution of stratospheric heights continues to be suggestive of a tropospheric reflection of higher than normal geopotential heights across the Arctic [especially the Pacific side] southward into AK and western Canada. As the wave-1 induced displacement begins to re-orient the 10hpa vortex toward northern Europe, we see some stratospheric height rises occurring in the west based NAO region as well. This is why (IMO) you're starting to see some semblance of increased central / west based -NAO ridging in the Feb 10th-15th period. If not for the destruction of the Pacific on the ECMWF ensembles, it would be a very good pattern. Seems to be that it is overestimating the influence of the weak IO/W PAC MJO forcing. Other indicators don't necessarily concur w/ that progression. AAM tendency and GWO orbit also argues for Pacific Jet retraction, but not to the extent the LR ECMWF indicates, whereby a La Nina-like tropospheric circulation pattern develops.
Stratosphere wise. Very interesting / unprecedented situation this year. Record temperatures up to 90N w/ a 70-75 K increase, record daily wave-1 amplitudes, and possibly record energy transfer / heat flux values, yet we will narrowly miss the technical 60N / 10hpa wind reversal definition necessary for a major SSW. Still, we're looking at one of the most significant zonal wind reductions in the records as far as stratospheric warming events. The unprecedented cold / strong state of the vortex this year will be able to survive against some of the strongest wave-1/displacement activity we've seen. Regardless, the sensible weather tropospheric evolution will generally be as if we did attain the major SSW displacement in my opinion (for the US). Europe will not see the benefits as they need to see the vortex driven further south to benefit from more northerly flow.
Interesting month ahead!!


Cliff notes: The PV (polar vortex) gets displaced which will open the door for arctic air to flood into the conus - and Feb 12thish to 18thish time frame we go into the Deep Freezer - just like last years record or deep freezer like cold!
Ummmm do I have to say this again..................well WTH - ONE MORE TIME :
TROPICAL FORCING FTW!!!!!!!!!!!!

Still having a difficult time buying into the total collapse of the Pacific pattern progged by the ECMWF ensembles for mid February. Latest bias corrected ECMWF MJO guidance continues to weaken the amplitude of the wave such that it's barely coherent propagating through octants 4-5-6. Additionally, the upper divergence signal in the central tropical Pacific will be much more significant than the IO/Indonesia convection, which leads me to believe the lower than normal heights will not shift into AK/British Columbian coast for D 10-15. Furthermore, the evolution of stratospheric heights continues to be suggestive of a tropospheric reflection of higher than normal geopotential heights across the Arctic [especially the Pacific side] southward into AK and western Canada. As the wave-1 induced displacement begins to re-orient the 10hpa vortex toward northern Europe, we see some stratospheric height rises occurring in the west based NAO region as well. This is why (IMO) you're starting to see some semblance of increased central / west based -NAO ridging in the Feb 10th-15th period. If not for the destruction of the Pacific on the ECMWF ensembles, it would be a very good pattern. Seems to be that it is overestimating the influence of the weak IO/W PAC MJO forcing. Other indicators don't necessarily concur w/ that progression. AAM tendency and GWO orbit also argues for Pacific Jet retraction, but not to the extent the LR ECMWF indicates, whereby a La Nina-like tropospheric circulation pattern develops.
Stratosphere wise. Very interesting / unprecedented situation this year. Record temperatures up to 90N w/ a 70-75 K increase, record daily wave-1 amplitudes, and possibly record energy transfer / heat flux values, yet we will narrowly miss the technical 60N / 10hpa wind reversal definition necessary for a major SSW. Still, we're looking at one of the most significant zonal wind reductions in the records as far as stratospheric warming events. The unprecedented cold / strong state of the vortex this year will be able to survive against some of the strongest wave-1/displacement activity we've seen. Regardless, the sensible weather tropospheric evolution will generally be as if we did attain the major SSW displacement in my opinion (for the US). Europe will not see the benefits as they need to see the vortex driven further south to benefit from more northerly flow.
Interesting month ahead!!
Cliff notes: The PV (polar vortex) gets displaced which will open the door for arctic air to flood into the conus - and Feb 12thish to 18thish time frame we go into the Deep Freezer - just like last years record or deep freezer like cold!
Ummmm do I have to say this again..................well WTH - ONE MORE TIME :
TROPICAL FORCING FTW!!!!!!!!!!!!
_________________
Mugs
AKA:King: Snow Weenie
Self Proclaimed
WINTER 2014-15 : 55.12" +.02 for 6 coatings (avg. 35")
WINTER 2015-16 Total - 29.8" (Avg 35")
WINTER 2016-17 : 39.5" so far
amugs- Advanced Forecaster - Mod

- Posts : 15093
Reputation : 213
Join date : 2013-01-07
Age : 54
Location : Hillsdale,NJ
Permissions in this forum:
You cannot reply to topics in this forum|
|
|