
 Search
Current date/time is Sat Apr 27, 2024 9:54 pm
Search found 8 matches for 3
DECEMBER 8TH 2021---First real accumulating snow potential ????
rb924119 wrote:Now that I've had a chance to glance at tonight's 00z suites coming in, I like the trends aloft even though the surface maps are not yet where I think they will end up.
00z GFS Ensemble 500mb height anomaly trend:
00z GEM/CMC 500mb height anomaly trend:
Morning everyone!!!!! Here is the Link to Rays video he posted in the Discussions thread. I encourage everyone to take a listen. Its phenominal:
https://drive.google.com/file/d/1gonDCUaWVuA3Grk8Khi_qgno0tRQHRm5/view?usp=sharing
Ray phenomenal video! Thank you. I wish I could do video's too. I feel like it would save me so much time. I am; however, going to have to respectfully disagree with a couple of points you make. Well maybe not disagree but more point out a few key areas that I did not see you comment on and what I feel are just as important, if not more important.
I will focus on the GFS only to make my points. Some of this was already discussed in my last write up. Ray in your video you discuss the trough split of the Pac energy and discuss the piece ejecting out vs the piece that backs up off the WC. It felt like you were inferring that the energy that gets ejected ends up being the energy that is our system. This part I disagree with.
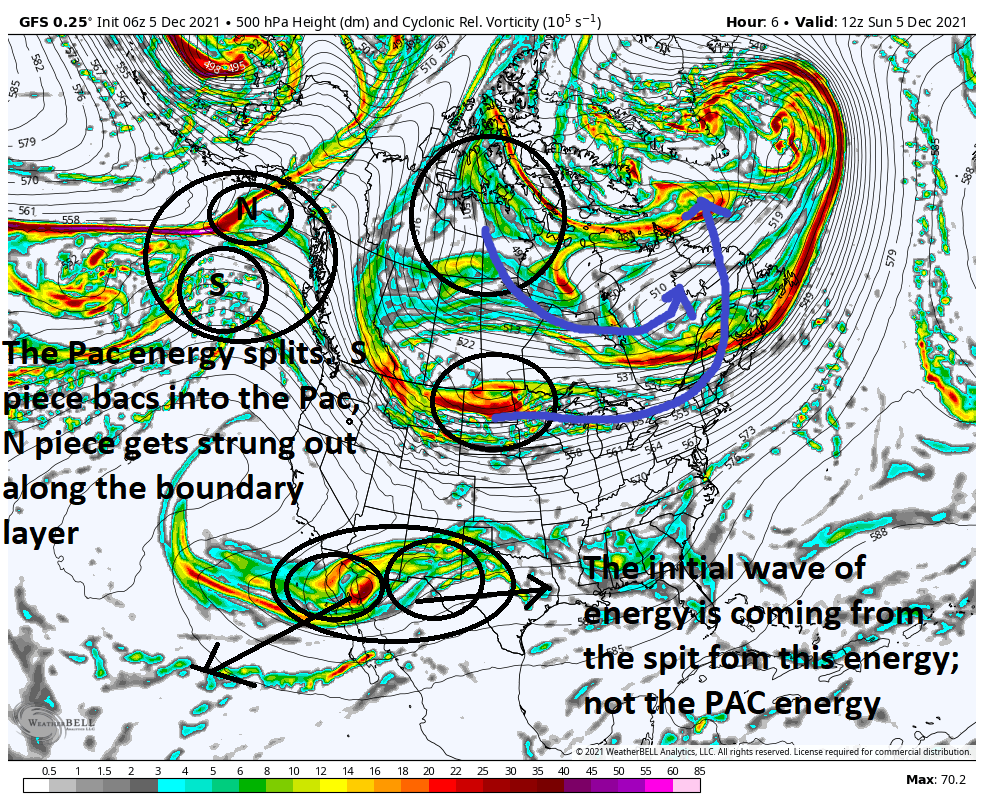
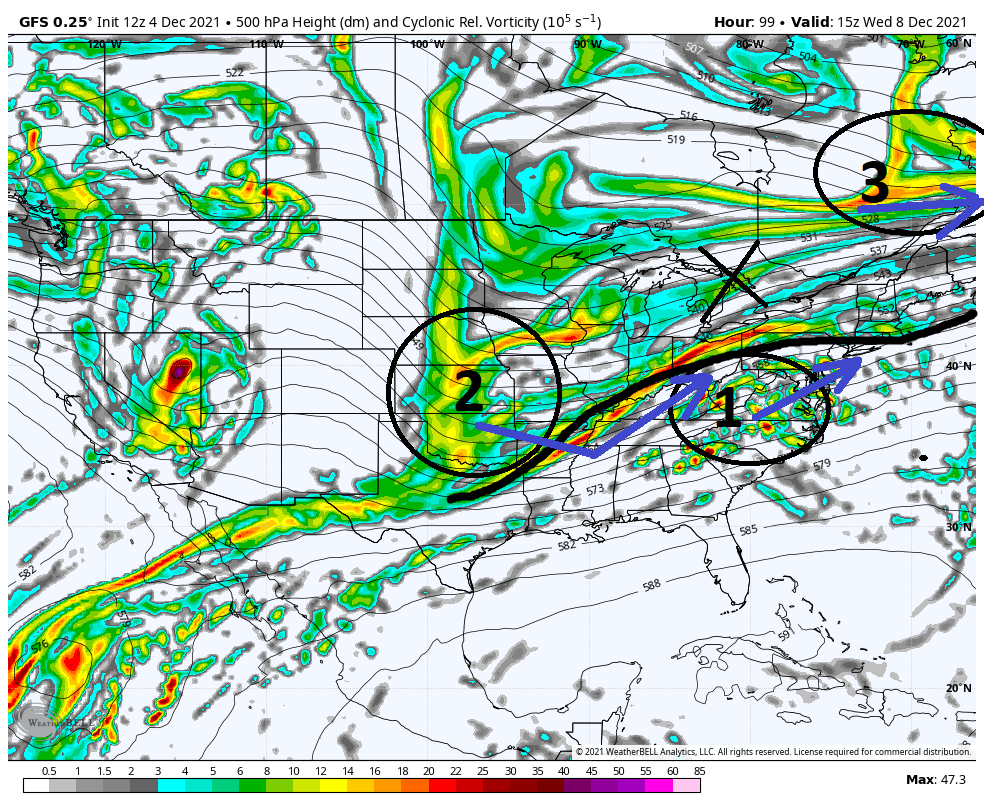
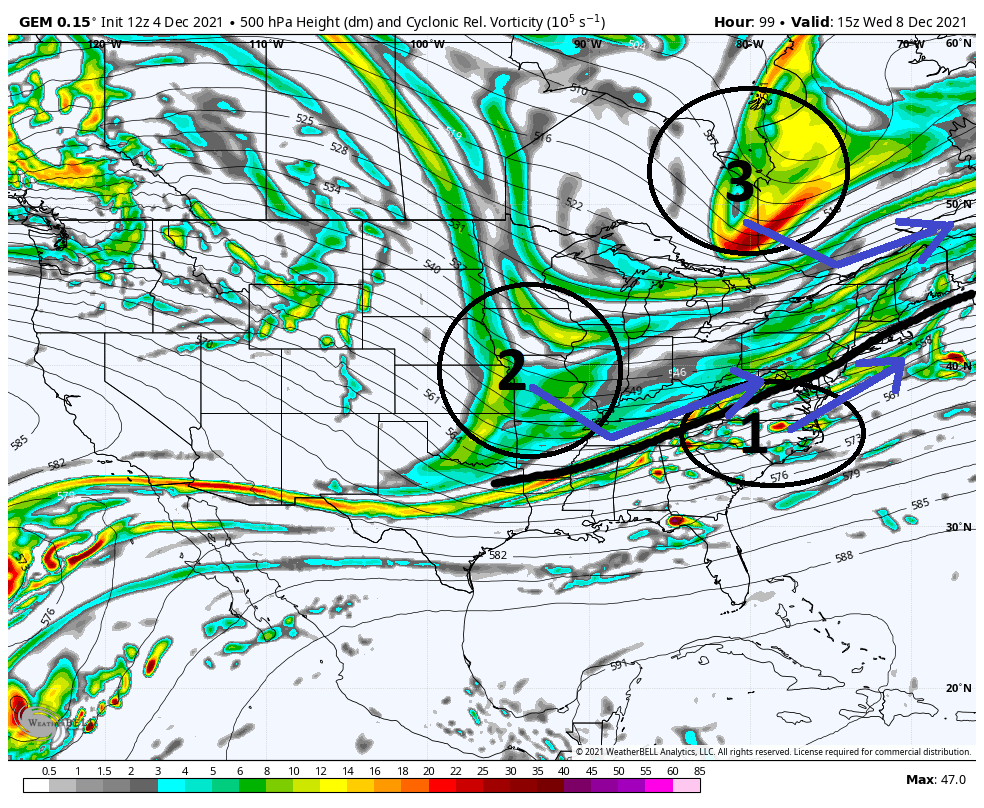
Above is hr6, or about 7am this am, from this am's 06z GFS. In addition to the trough split from the Pac energy as outlined in the video, there is a second trough split associated with the trough in the Sub Trop region. Its this energy that gets ejected that will eventually give rise to the LP that develops near or just off the coast. The energy that gets ejected from the Pac energy ends up strung out along the boundary layer that develops from the system that passes late tomorrow night. The other area not mentioned in the video are the two circles not labeled. The one over the N plains CONUS is the late Mon system that heads towards Greenland. The one to its N is another key factor IMHO that I mentioned in my prior discussion. Ill get back to this point shortly
Fast forward to Hr 72:

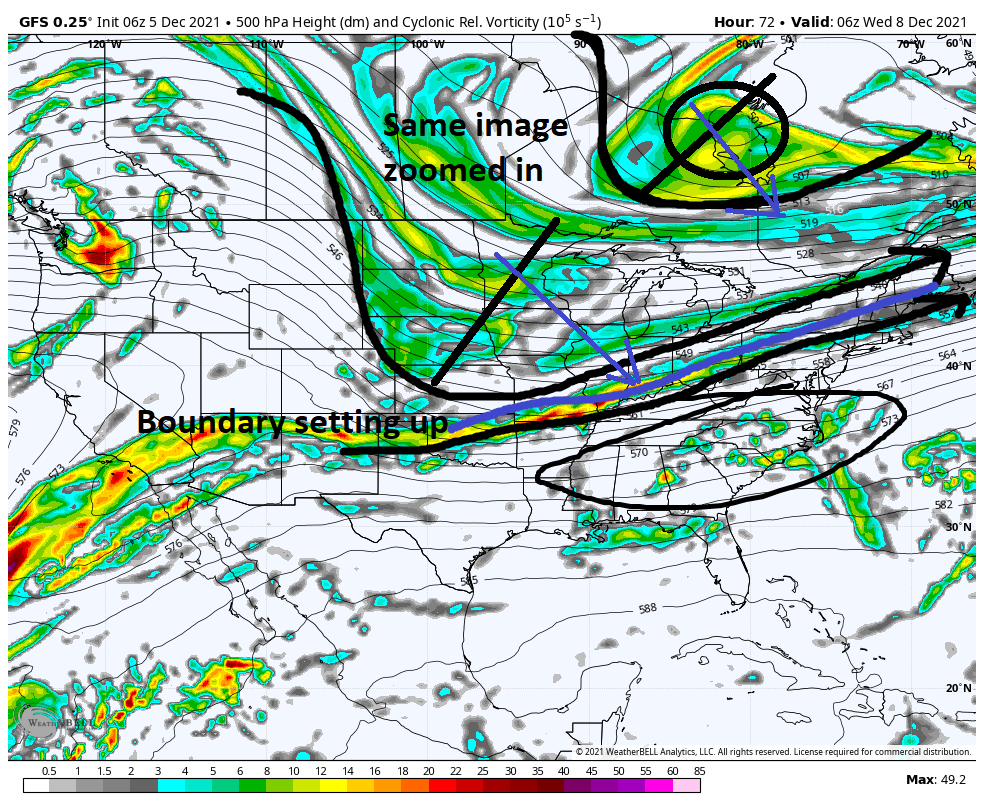
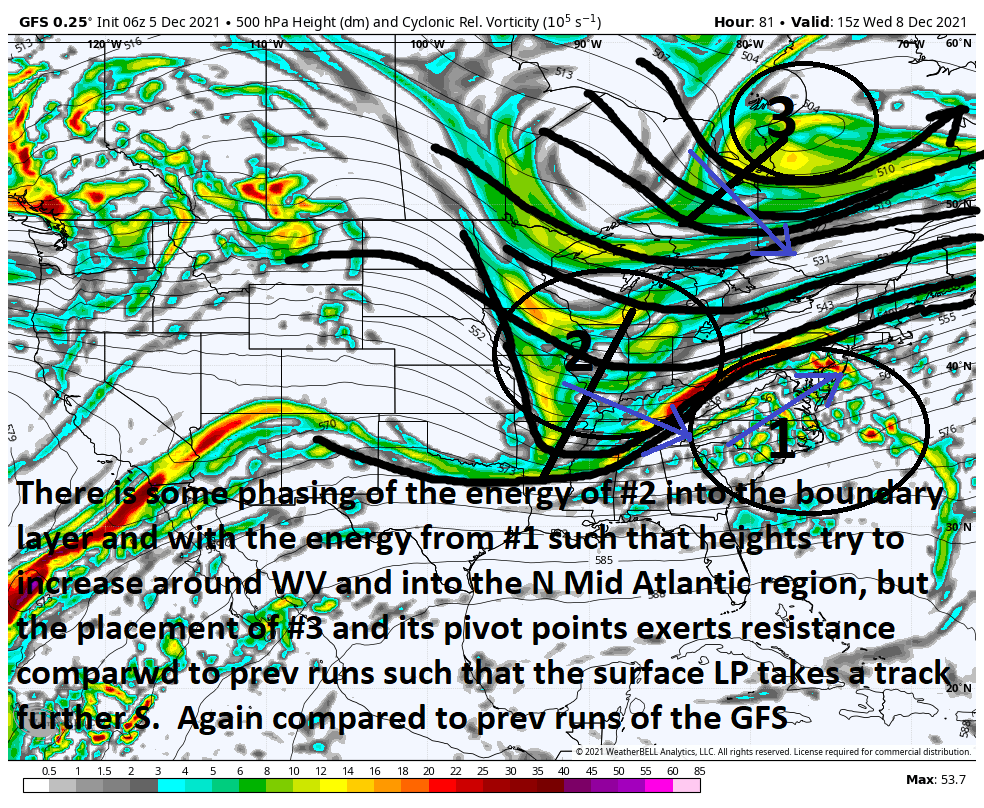
Above is the same image zoomed in on the CONUS view. Notice that there ae two troughs out lined. One N of th GL and the other digging into the plains. Each has its own pivot point. What seems to be very clear to me in the evolution in the modeling is the positioning of that trough N of the great lakes. This feature is absolutely vital in preventing heights from increasing ahead of the system.
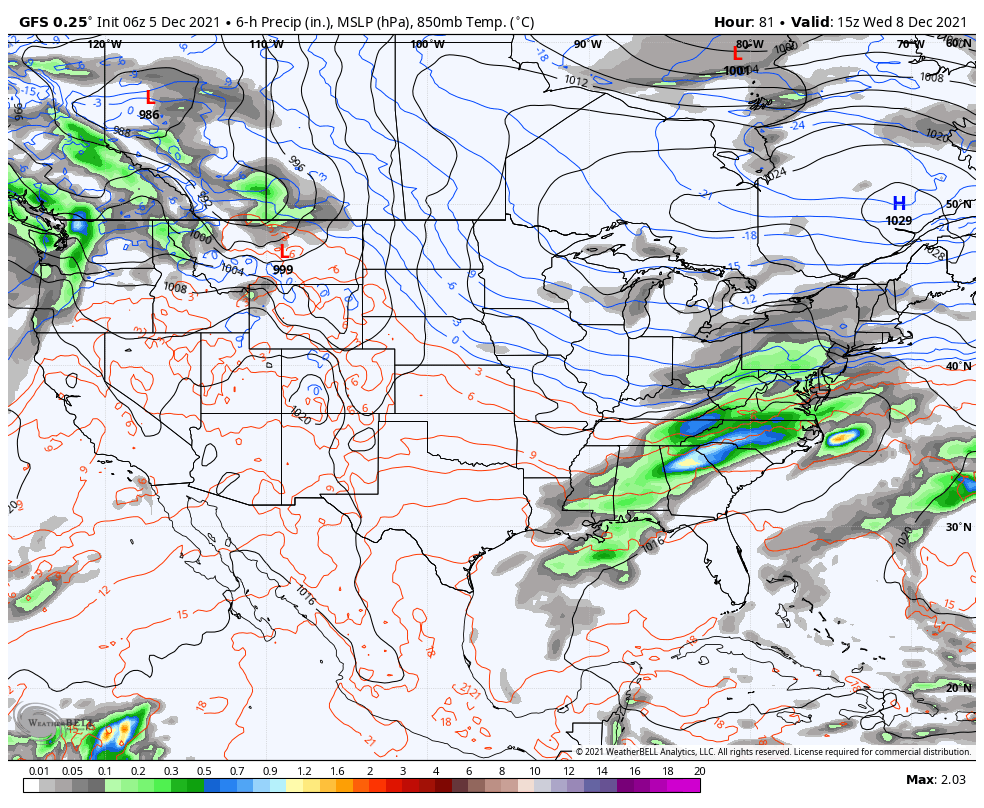
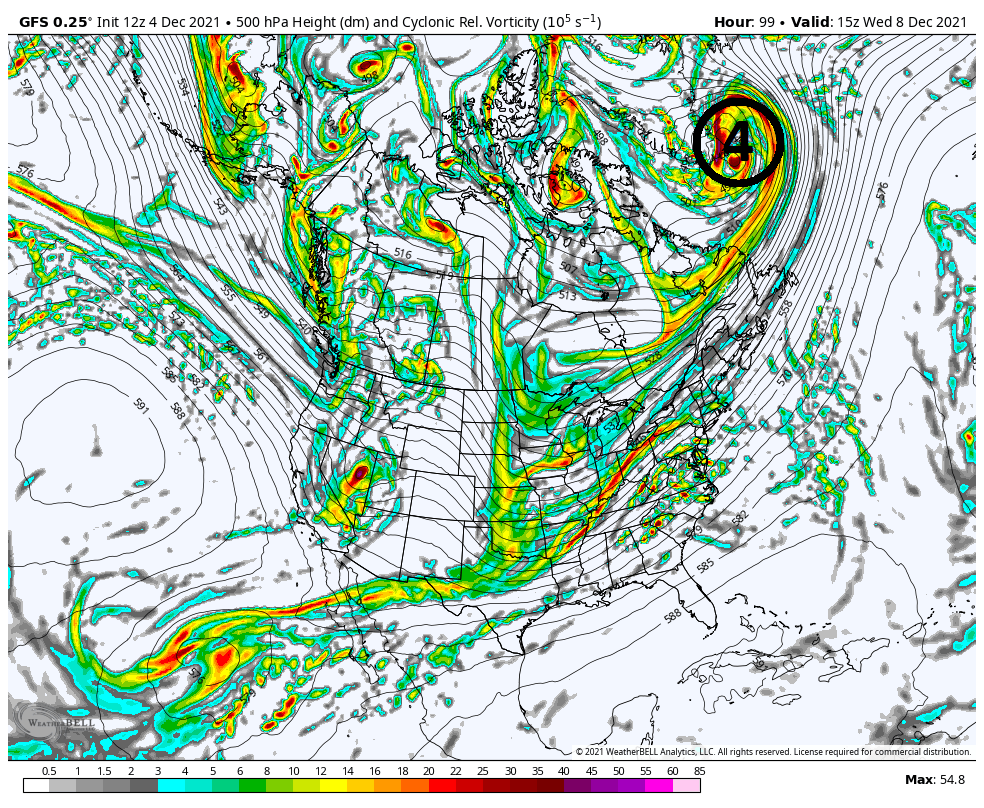
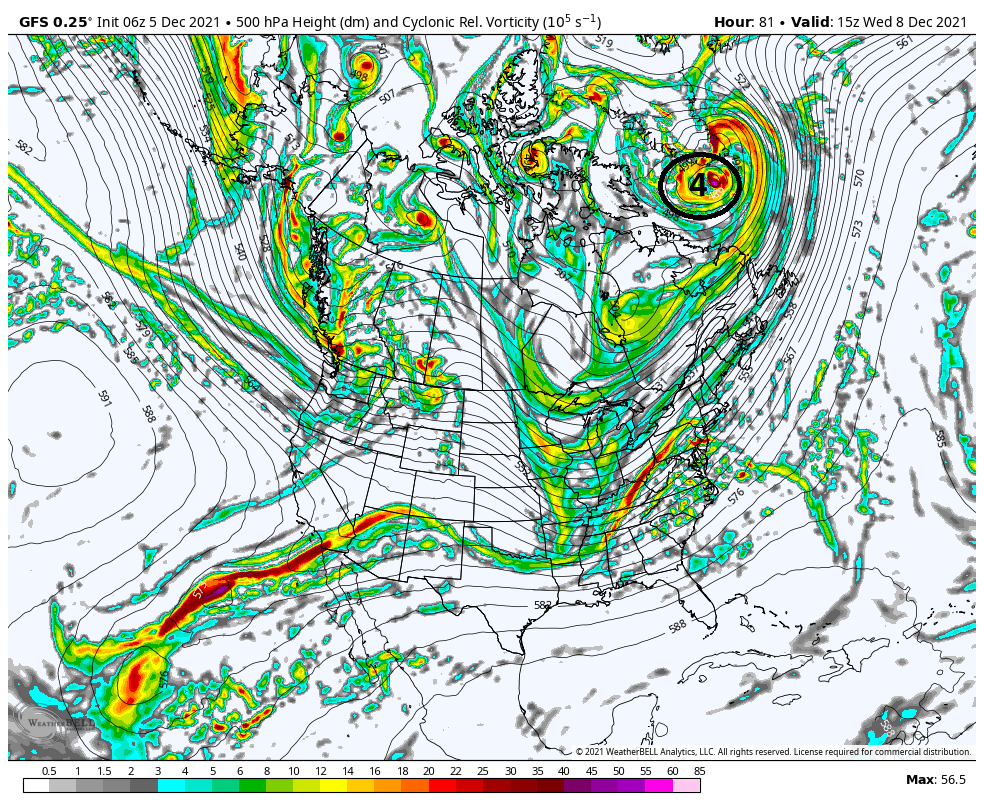
Look below to Hr 81 on this mornings 6z. BUT FIRST lets look at the same time stamp Wed 15z from yesterdays 12z GFS that I posted in my prev discussion and compare it to this mornings 06z run and pay attention to where that trough N of the GL is. With it further east and north on yesterdays 12z run there is no resistance to the height increase from the trough digging into the Plains phasing into the boundary layer. The result is a LP track into the Tenn Vally, and a much warmer soln on yest 12z. Vs the 6z from this am the placement of the GL trough is acting to limit the ability to raise heights leading to a colder soln relatively speaking when comp to12z yest.


Briefly getting back to this point I made at the beginning of todays discussion:
The other area not mentioned in the video are the two circles not labeled. The one over the N plains CONUS is the late Mon system that heads towards Greenland. The one to its N is another key factor IMHO that I mentioned in my prior discussion.
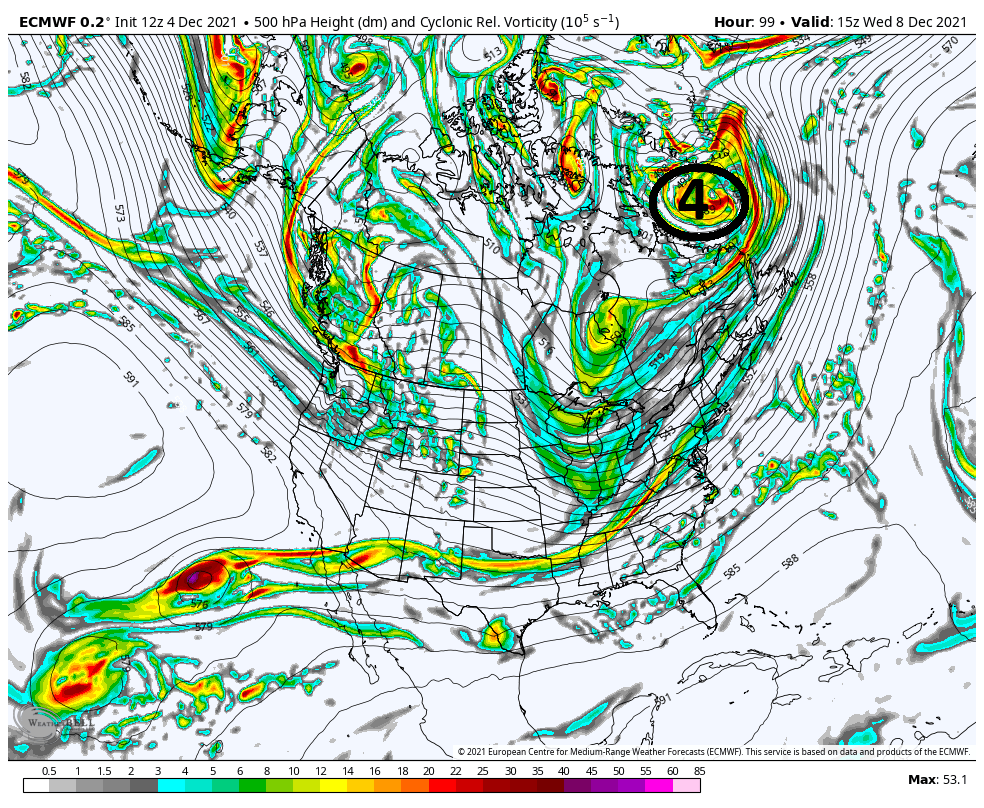
The trend for the Monday system is to be further S from prev. First image is yesterdays 12z map and the second is this mornings 6z both valid for 15z Wed.
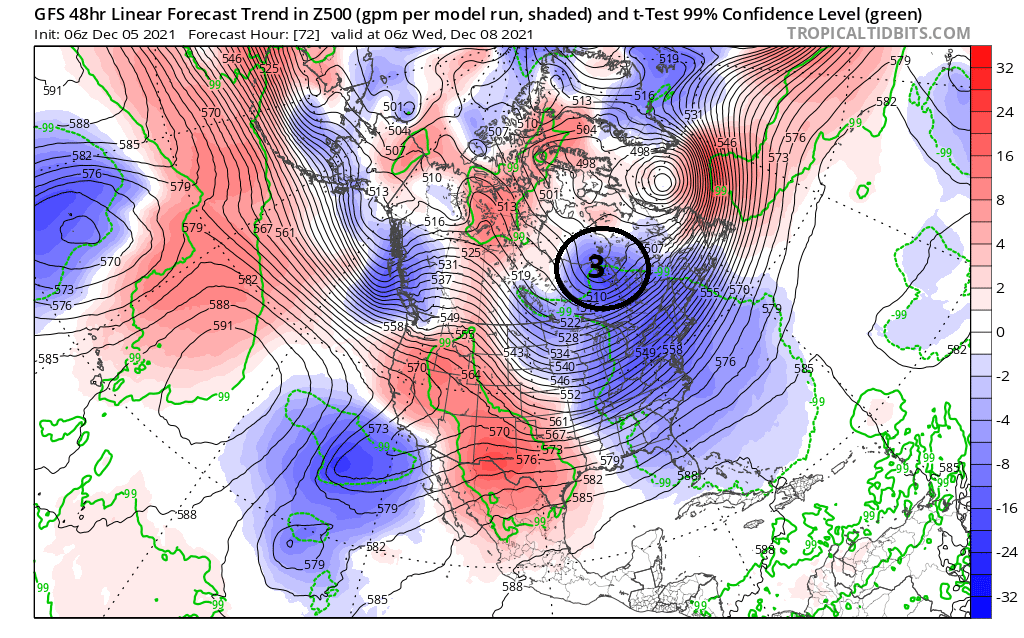
You can see the center is now south of Greenland's SE tip compared to yesterdays 12z run where it was due east of Greenland's SE tip. In addition to that, look at the map below. It shows the GFS trends. The area I have circled is the energy I have labeled #3 in the discussion maps above and you can clearly see it is trending darker blue which means lower pressure in the area just N of the GL. Again this energy/feature offers the only resistance against the otherwise immediate surge of the warm layers as energy #2 phases with #1 because both the Pac and Atlantic pattern does not offer any real help at all.
Myself, Ray(rb, Frank, Heehaw, Mugsy, Al etc., have all pointed out that we are not in a great pattern for snow. But as I have also pointed out in the past, it can still snow in shitty patterns when things come together just right. We just need BABY BEAR. (My Baby Bear here on Long Island may be slightly diff than Baby bear N&W of NYC, but you get the point)
We still have a little ways to go to see how we trend last minute. The GFS is def still the warmest and wettest soln but it is on its own at the moment and has 100% been trending colder due to the things I outlined above. The Euro, CMC, and now NAM(although NAM still not in its wheelhouse yet) all have a much more suppressed colder soln overall. To me the trend towards a colder soln has been clear across all models, keeping the entire region, including the immediate coast in play for accumulation, but remember very tiny changes at 500mb can lead to much larger changes at the surface for better or worse (warmer or colder)(wetter or dryer-OTS) relative to your specific location so stay tuned as we are approaching game time.
WE TRACK!!!!!


- on Sun Dec 05, 2021 9:03 am
- Search in: Official Weather Talk Thread
- Topic: DECEMBER 8TH 2021---First real accumulating snow potential ????
- Replies: 44
- Views: 4189
December 2021 Obs and Discussion
heehaw453 wrote:Many op models showing a fairly stationary 1030mb+ High parked over Southern Quebec. I don't think this is going to be suppressed and OTS with a decent WAR. That gives the coastal plain a chance at some snow if that high pressure is correct. The antecedent air mass is good for early December on this and I can tell you that high pressure CAD is often under modelled. It will depend on how far away from the coast the storm consolidates. Once again though NW of 95 are in a threat for several inches of snow especially I-80 and above.
Looking at 500 you can see why that makes sense and why the GFS still has the HP retreating quickly, and is warmest soln, the Euro is the most suppressed and coldest soln, and the CMC is in between.
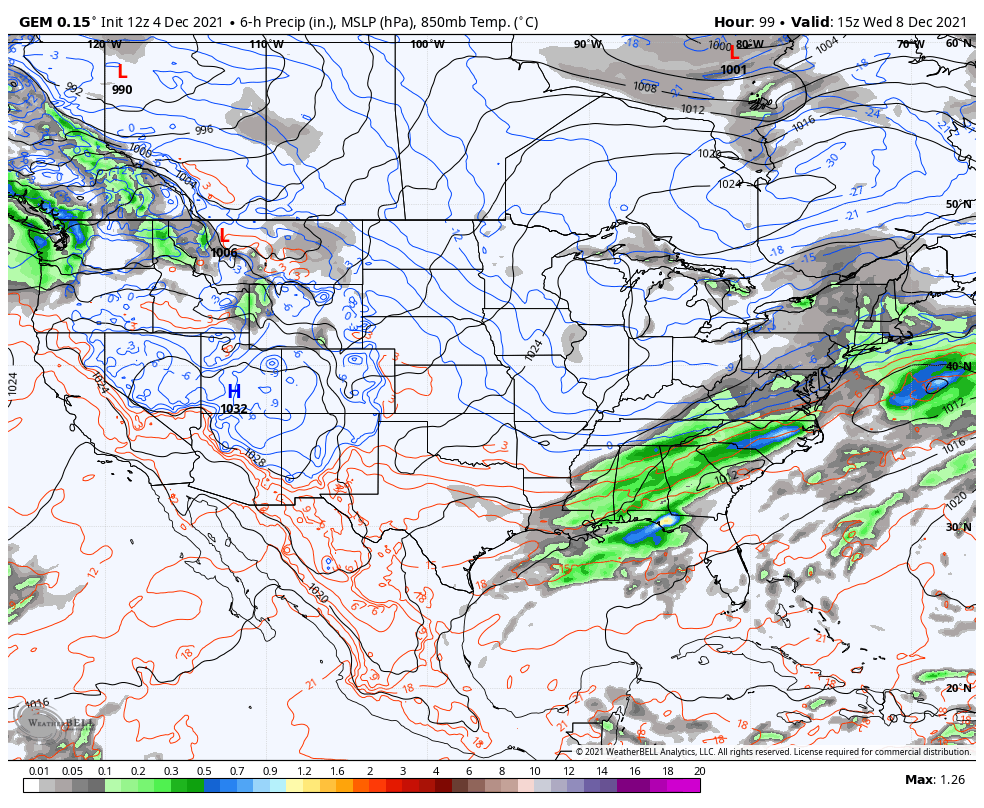
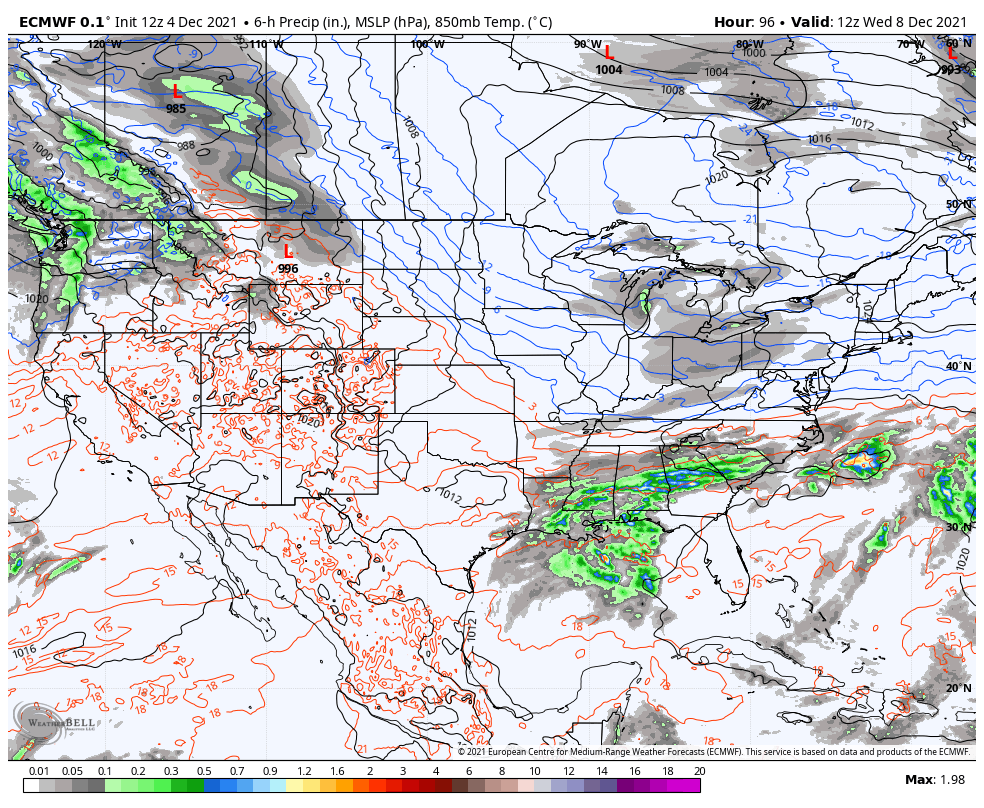
Here are the three global models at 500mb on approach and their respective surface depiction for the same time stamp. All valid for 15z Wed, or 10am Wed. Euro, CMC, and GFS.
The set up is such that a boundary layer will set up after the Late Mond system passes NW and drags the front through. Along the frontal boundary weak LP will develop, black circle #1, and ride along it. On the GFS you can see the result of #3 so far east and # 2 so far S&W relative to one another and the fact that #1 is out in front of #2 allows the boundary layer to set up furthest N of all solns.
The euro on the other hand is the other side of the soln cone where the proximity of both #3 to #2, forces the boundary much further S&E.
The positioning of #1, #2, an #3 relative to each other is in between the GFS an Euro.
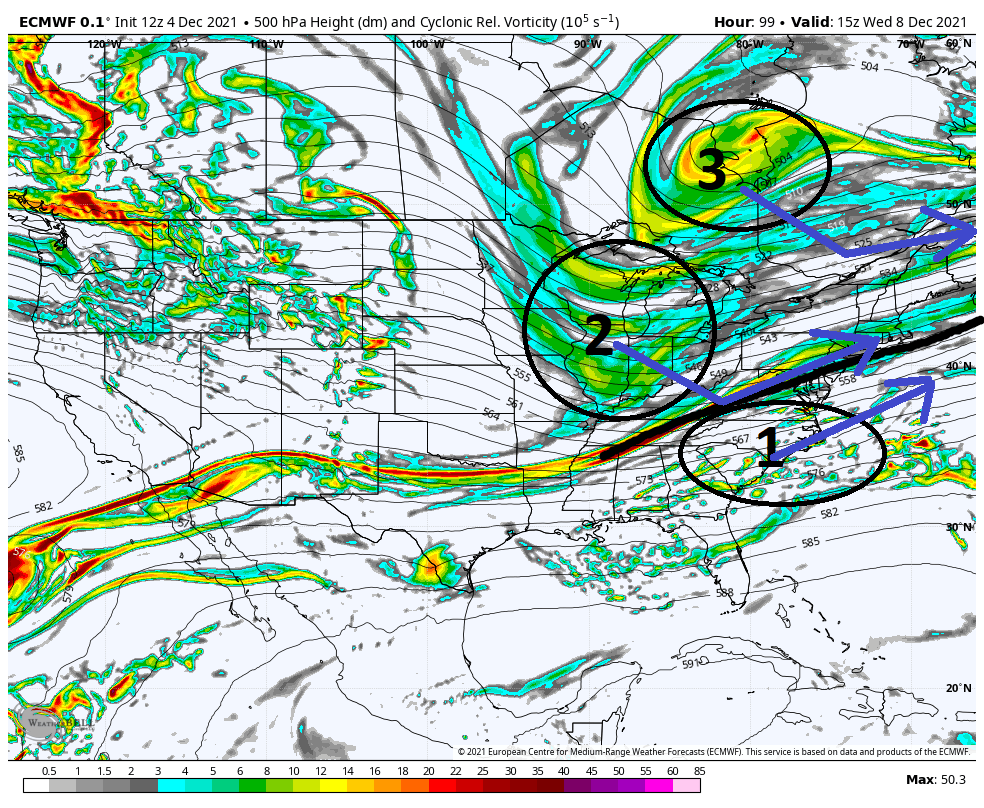
So if you look at the GFS as the current warmest soln, and the Euro as the coldest soln, very very commonly the final soln lies somewhere in between which def bodes well for most of us to see some white gold at least, and areas N&W in line for accumulation.
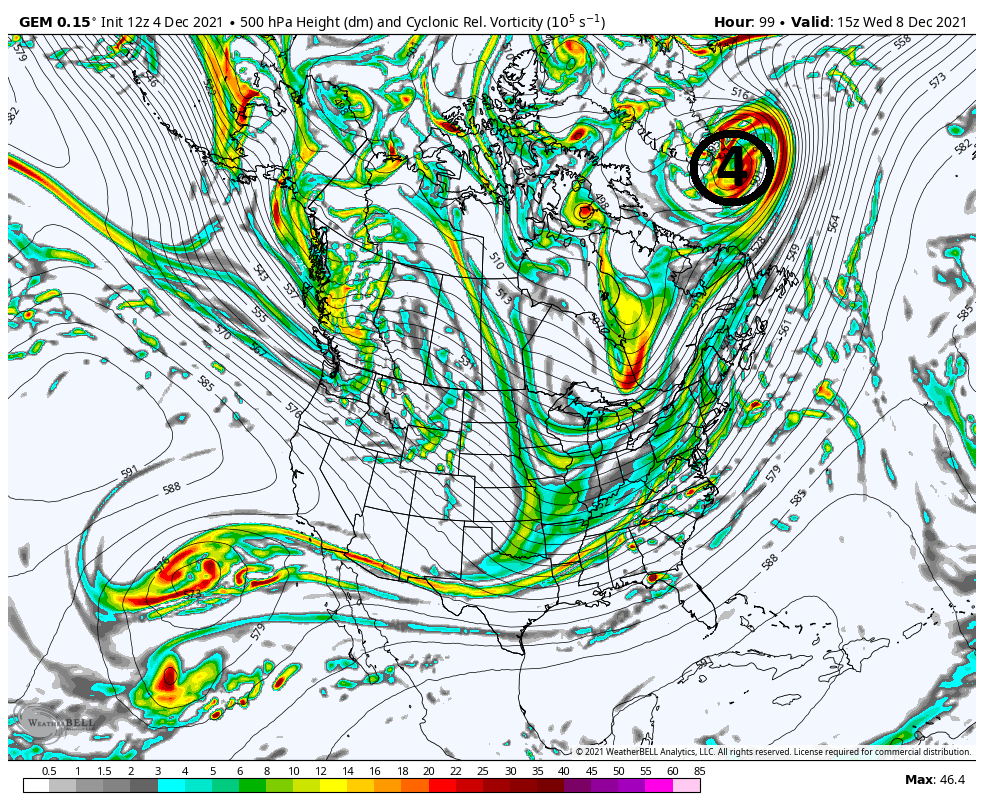
Just briefly below I expanded the 500mb view to see the location of where the system that passes Mondayends up. Again, GFS furthest N which allows our HP to escape faster, hence the warmer soln. Euro is the furthest S, and CMC in between.
Im getting a little excited.
WE TRACK!!!!
- on Sat Dec 04, 2021 2:23 pm
- Search in: Official Weather Talk Thread
- Topic: December 2021 Obs and Discussion
- Replies: 151
- Views: 10421
Banter Thread 6.0
amugs wrote:Updated 2020-2021 seasonal snowfall totals as of April 18th. The snow from last week's storm bumped Worcester MA to #3 ahead of Buffalo NY on the list of Eastern US NWS climate stations. pic.twitter.com/mK2iQaxHfr
— NWS Eastern Region (@NWSEastern) April 18, 2021
SICK SNOW MAP!!! ONLY FLA did not have measurable snowfall this winter!! Extreme your bet your tushie!
Thanks Mugs for posting this! Quite ironic and funny actually that this is the most recent post, because today is the first day I've logged on in like a month and I came today to finally post a few quick thoughts about this past winter, but almost didn't cuz I was like 'who even cares about winter anymore'. ha ha.
Anyway, first and foremost, I wanted to thank all of the regular contributors (the Mods, Mets and Members alike) for making the winter season a really fun one on the forum. The amount of time that you all put in to educate and entertain is really appreciated and added a lot imo to this year's Return of the Snow!
Regarding the snow map and winter '20/'21 itself, I think it was CP who said that February roared and most of the rest of the winter was a dud much the last two winters in general. My part of coastal Ocean County finished with just over 20", on a total of 5-6 events of 1" or more. The two 'bigger' totals were 4-5" each on Sun Jan 31 and Super Sunday a week later. The Jan 31 storm was tempered by the r/s line for the biggie (2/1-2/2) setting up on top of me- especially after I was in the Bullseye just 36 hrs out.
Still, the big theme for me was the Return of the Snow and the February parade of storms. The kids had their fill for sure! We also got a dose of thundersnow down here as I recall!
Overall grade: B. And thanks again!
- on Mon Apr 19, 2021 12:08 pm
- Search in: Official Weather Talk Thread
- Topic: Banter Thread 6.0
- Replies: 732
- Views: 37670
Banter Thread 6.0
Updated 2020-2021 seasonal snowfall totals as of April 18th. The snow from last week's storm bumped Worcester MA to #3 ahead of Buffalo NY on the list of Eastern US NWS climate stations. pic.twitter.com/mK2iQaxHfr
— NWS Eastern Region (@NWSEastern) April 18, 2021
SICK SNOW MAP!!! ONLY FLA did not have measurable snowfall this winter!! Extreme your bet your tushie!
- on Sun Apr 18, 2021 8:10 pm
- Search in: Official Weather Talk Thread
- Topic: Banter Thread 6.0
- Replies: 732
- Views: 37670
February 1st-2nd Roidzilla, Part IV: Final Forecast
DT (Wrisk) latest Facebook post on current one:2PM UPDATE
After looking at all the latest data ...the short-range models and the radar there are some changes to be made in the forecast because there has been a decisive and significant change here at the last minute with the formation of the coastal oh.
First lets look at some regional Radars and see what is going on. This recent radar image from 12:30 PM Sunday shows the dry slot which has pushed all the way through the Shenandoah Valley and into the Washington DC Metro area with significant brakes in the snow Shield. However there is still moderate and significant snow in the Northern Neck … Fredericksburg … into southern Maryland as well as the Eastern panhandle of West Virginia … central and northern Maryland and Baltimore. SEE IMAGE 1
Also note the significant rain in northern portions of West Virginia Southern Ohio.
IMABE #2 is the radar forecast for 313PM and 5PM this afternoon. As you can see the dry slot has pushed its way up into Washington DC but has halted across the DC suburbs in Northern Virginia. It has also pushed up into Winchester and close to Hagerstown. In Central Virginia; The precipitation is mostly rain and its heavy rain in southeast Virginia eastern North Carolina and the southern Delmarva.
The short-range radar forecast shows that the snow is going to fill back in across northern Virginia during the evening hours but I am not certain if that is actually going to happen. The data says it should but I am a bit skeptical that the snow is going to build back in that much by 5 or 6 p.m. this evening in northern Virginia the northern Shenandoah Valley and DC Metro.
By 9 p.m. this snow has pushed into the North and there are just areas of sleet and light snow mixed mostly north of DC in central and Northeast Maryland. Notice that nothing is occurring south of DC or in the Shenandoah Valley or the Eastern panhandle of West Virginia IMAGE #3 And at 3 a.m. not much is going on in northern Virginia Maryland eastern portions of West Virginia and the Delmarva either. It looks pretty quiet.
The initial forecast from back on Thursday and Friday had the formation of the coastal LOW close to the Delmarva or just offshore for much of Monday. Having the coastal LOW in that position would allow for the circulation of the large coastal LOW to pull the snow down from Pennsylvania New York and New Jersey into Maryland and Northern Virginia and the Eastern panhandle of West Virginia… and probably back into the Washington DC Metro area… the northern Shenandoah Valley and perhaps central and northeast Virginia. Moreover because the coastal LOW was going to stall close to the Delmarva Peninsula it would cause easterly winds to bring milder air into southeast Massachusetts Boston Rhode Island eastern Connecticut eastern Long Island changing the snow to rain and reducing the snow amounts in those areas that significantly
However as you can see the new data clearly does NOT do that. Instead the coastal LOW is much further to the north and east. This means that the Boston and Southeastern New England area see their winds stay North or Northeast so temperatures there are cold enough to support snow and all of eastern New England gets pounded with anywhere from 12 to 18 inches of snow.
But in the Maryland DC Baltimore Northern Virginia region ...the shift of this Coastal LOW for the to the north means that any wrap around snow on Monday is going to be significantly less than earlier forecasted. in addition... the area of moderate and heavy rain in the Ohio Valley which earlier forecasted to move into Northern Virginia Baltimore central Maryland for Sunday night into Monday … is going to stay further to the north because the actual costal LOW pressure area is tracking further to the north.
We can see the shift here on the models for tomorrow. At 7 a.m. IMAGE #4
on Monday the coastal LOW is significantly further east than what the data was showing either yesterday or on Friday. There is a huge dry slot across all of Virginia Maryland and even into Southeast Pennsylvania. Only yesterday the models for producing huge snow falls in Philadelphia and Southeastern interior PA. But now it looks like even that area will see much less snow.
During the day on Monday at 1 p.m. and 5 p.m. the coastal LOW is significantly further to the north when compared to what It was showing yesterday or on Friday or on Thursday. This keeps all the heavy precipitation north of Philadelphia into northeast Pennsylvania…. New York City / North Ne Jersey and New England. But it also means that any wrap around snow showers on Monday in northern Virginia the northern Shenandoah Valley in the Eastern panhandle of West Virginia will be minor if any.
IMAGE #5
And clearly this shift means that the snow forecast map in the LAST CALL as well as the FIRST CALL forecast maps for Northern Virginia and Central Maryland and even into Southeastern Pennsylvania are probably going to bust.
WHAT THREW ME OFF (and many other mets as well )-- was that fact that last week the coastal Low was forecast to be off Norfolk on Monday NOT south of eastern Long Island NY .
- on Sun Jan 31, 2021 6:22 pm
- Search in: Official Weather Talk Thread
- Topic: February 1st-2nd Roidzilla, Part IV: Final Forecast
- Replies: 706
- Views: 28732
Long Range Discussion 20(20) (Ha!)
sroc4 wrote:
Despite the big picture looking decent the more individual vort maxes invloved the more precise everything has to come together. Coordinating 2 or 3 pieces of energy in a good pattern vs coordinating 5-6 pieces is exponentially more challenging. If just one is in a bad spot it induces the chain reaction to reshuffling the rest. And as we all know small changes at 500 have big implications on the surface. We shall see.
Regarding the 12th -13th potential. Todays 12z GFS gives you an idea of how complex it is. CONUS view:

#1 is our southern system. #2 ideally needs to dig into the back of it. However; #3 is diving into the NE from the north compliments of the -NAO block we have as 1 & 2 appraoch. The result is the inability for our system, #1, to raise heights out ahead of it on its own and suppression since #2 really isnt interacting until its too late.
Now look at our PNA region aka west coast. #4 is crashing the coast at just the wrong time. Result is flattening the northern component of our +PNA ridge. Result is the polar branch is flatter preventing #2 from digging into the back side of #1. If this happened it would combine energy, aka phase, which means stronger storm. Stronger storm = better chance to raise heights out ahead. Raised heights out ahead = storm comes north up the coast.
As if 5 pieces of energy wasnt enough to coordinate. Lets zoom out a bit. North America View:
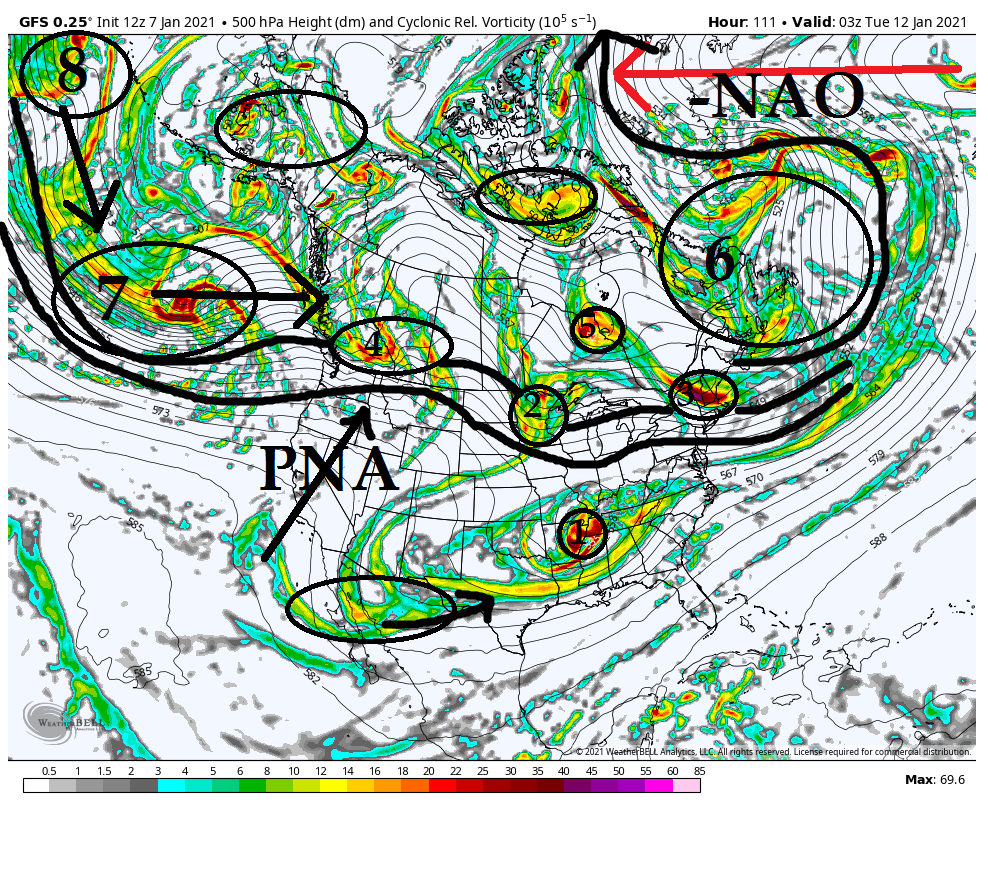
You can see the -NAO ridge is causing a major bottle neck of the energy (#6) in the N Atlantic. This is a good thing in general but Ive said it before sometimes too much of as good thing is a bad thing. In this case can lead to supressed strom tracks. ESP hen the Pac isnt cooperating which is the case in this image.
Look west. Wave after wave of energy is traversing the N Pac and crashing the west coast (8 to 7 to 4). The result is a PNA ridge that tries to amplify but consistently gets knowcked down. Timing has to be perfect with 1 and 2 as they approach the EC when you have such strong blocking in the NAO region otherwise the result is a flatened flow across the northern teir of the CONUS preventing N energy (ie: #2) from digging.
Now here is the thing. We often times get storms to come up when the NAO is relaxing. The reason is as it relaxes it allows our system to come up because it doesnt push so hard. We fortunately have the NAO forecast on both Euro and GFS ensembles to go from a -3 deviation to a -1 deviation. Will this be enough of a relaxation to our NE to allow our system to come north "enough" is yet to be determined.
Dont let the specific verbage from Ray confuse you. He is 100% correct in his idea that the chance isnt great given everything I'm showing above and just how many pieces of energy have to coordinate, BUT there is a chance. And its a decent chance IMHO. I believe models will correct as we get towards saturday or so showing a little more digging of #2 and perhaps a little more interaction between #1 and #2. I also think we see energy like #3 change in the modeling to be out of the way a little more. Again is it enough to make it work...odd favor against it at this time IMHO.
- on Thu Jan 07, 2021 1:33 pm
- Search in: Official Weather Talk Thread
- Topic: Long Range Discussion 20(20) (Ha!)
- Replies: 732
- Views: 31764
January 7, 2017 “Wave #3”
I just saw these memories pop up on my phone, so I got inspired to tell the tale of Wave #3!By the time the blizzard of Jan 2016 hit, I was already following Bernie and fb groups for winter storms updates. In early Jan 2017, someone posted a link to this forum about the potential for the upcoming pattern. And so I hit the link and started to learn that the approaching system didnt look so hot and neither did the one behind it. But there was a 3rd wave behind that, and it just might produce some decent snow...especially for S and E portions of the board!! 🤪
And of course, I learned the two happy words that means it just might snow soon: We track!
Well, track we did and it turns out that wave #3 ‘popped’ a low off the southern Delmarva coast and it wasn’t strong and it didn’t produce massive snowfall rates, but it did intensify and track to just about the benchmark.
Down here in Bayville, GSP Exit 80, we cashed in 7-8 inches. But I remember it was a relatively ‘epic’ storm because it started snowing at 7 am just as we woke up and stuck immediately. By the time we had waffles and got geared up, there was 2” down and it was ripping!
If I recall correctly, 2 other features that helped some more of the northern portions and certainly LI hit Mothra levels were the fact the low stalled a bit as it turned NE and also this storm seemed to have endless back-building in the precip. I remember checking the radar around 1 pm thinking “Alright, another hour or so, maybe we get another inch”. And I said the same thing at 2 and 3 pm as well! By about 4 pm the steady snow started to slow and I slowly made my up the street for a Sicilian pie. (Schiano’s if you’re ever down this way).
The Shore dynamics are soooo hit or miss. But when they hit...we do well. We really threaded the needle on this one. Had a blast too!!


- on Thu Jan 07, 2021 1:03 am
- Search in: Storm Archives
- Topic: January 7, 2017 “Wave #3”
- Replies: 1
- Views: 768
12/16 to 12/17 Godzilla - 1st Call Snow Map
Frank_Wx wrote:A couple of things:
1. How many consecutive days did the GFS try to suppress the storm? Yesterday it made subtle shifts NW, and the EURO made a shift SE, and we thought they were meeting in the middle for consensus. Turns out, GFS has been wrong all along (so it seems after today's run), which begs the question why we even look at it??
2. It appears the NW shift is real, and many areas including CNJ/SNJ will see their forecasted snow amounts drop considerably on my final call map, but I am still thinking we're not done with seeing models move around. I don't think the final solution is shown on the models yet. It's possible this storm comes even MORE NW, given the negative trends we're seeing with the 50/50 and H5 trough, OR the models decide to tick back S-SE in response to the HP to the north.
3. I know point #2 sounded political or a typical "non-wrong" response, but there really is so much uncertainty with several features. I called some of them out in point #2, but the biggest question mark is where the 700mb and 850mb track. Ultimately that will depend on what the 500mb ULL decides to do too. We have not seen enough consistency from any one model to truly have a feel for this storm yet.
4. This just reminds you that people like RB and others are an asset to this board, because they can call BS on some of these model runs in an instant!
Let's see what the rest of today brings. Also, just a reminder to keep banter comments in the banter thread.
This tweet talks about #3
A mid level low (700hPa pictured) tracking over Scranton, PA is usually not a good sign for significant snow along the coastal plain, or even in NYC - and it opens up the door for rapid mid level warm air advection (read: sleet, dry slot). pic.twitter.com/0WTKZXbfHR
— John Homenuk (@jhomenuk) December 15, 2020
- on Tue Dec 15, 2020 11:21 am
- Search in: Official Weather Talk Thread
- Topic: 12/16 to 12/17 Godzilla - 1st Call Snow Map
- Replies: 297
- Views: 15744
