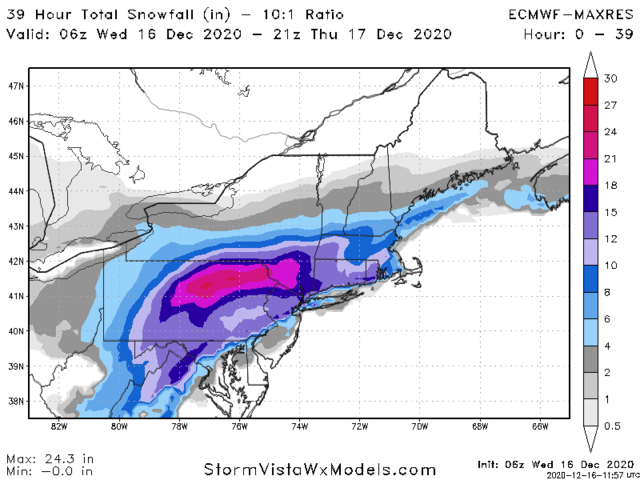
12/16-12/17 Godzilla: Final Snow Map & Obsevations
+62
MattyICE
Radz
tigernumba1
brownie
WeatherBob
Taffy
1190ftalt
jldio
Zhukov1945
Dunnzoo
RJB8525
lglickman1
Artechmetals
2004blackwrx
stAtic9
Grselig
dkodgis
Fededle22
Mac003
jwalsh
Vinnydula
elkiehound
Math23x7
frank 638
crippo84
SNOW MAN
pkmak
jaydoy
Sparky Sparticles
AMD95
SkiSeadooJoe
TheAresian
emokid51783
Irish
algae888
snowlover78
jimv45
weatherwatchermom
Scullybutcher
hyde345
essexcountypete
DAYBLAZER
CPcantmeasuresnow
amugs
heehaw453
dsix85
SENJsnowman
Joe Snow
sroc4
CnWestMilford76
mikeypizano
nutleyblizzard
bloc1357
billg315
docstox12
phil155
mmanisca
aiannone
jmanley32
SoulSingMG
rb924119
Frank_Wx
66 posters
Page 2 of 32
Page 2 of 32 •  1, 2, 3 ... 17 ... 32
 Re: 12/16-12/17 Godzilla: Final Snow Map & Obsevations
billg315 wrote:It’s interesting because the 6z GFS tracks the Low over South Jersey and the 500mb seems to track over NWNJ/NEPA which is exactly what rb has been pointing out and what logically is not good news for us, but in its surface output stands fast to its 10-15” area-wide snowfall with little mixing. So I don’t know what to think. It does pick up that dry slotting that every model is now showing - and of course the one consistency in this thing is the dry slot is modeled right near or over my backyard.
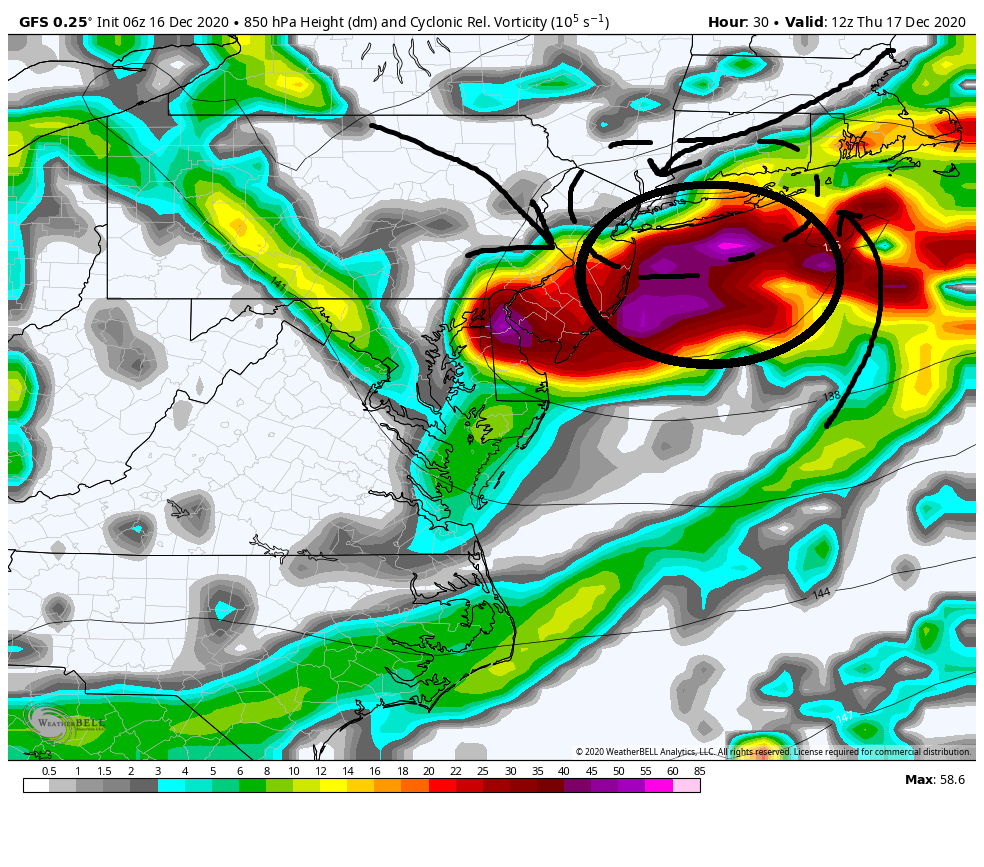
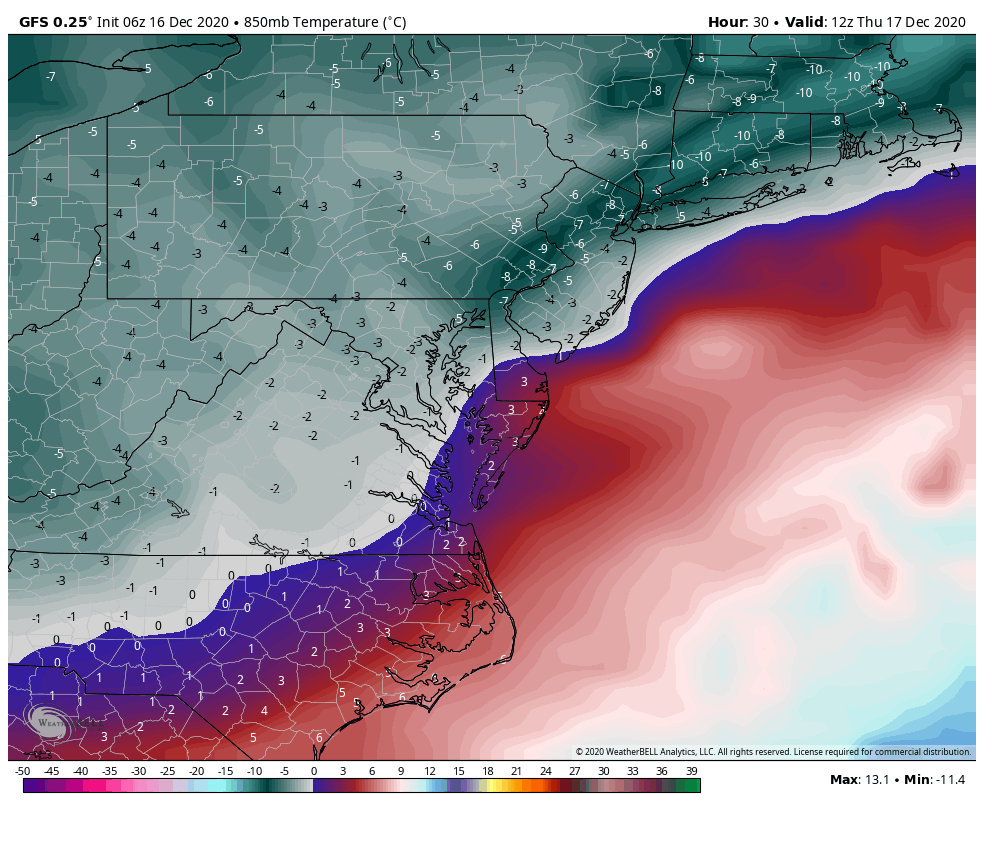
500mb never closes off at least not until well past us. its 850 and 700mb closed low that you need to follow to see where the warmth and or dry slot will occur. GFS and Euro cont to insist that 850 is just to the south of LI.
This is 850: The positioning on the 6x GFS is such that it keeps the freezing line just south of LI, but as soon as it scoots by temps at this level crash further. The dashed line however is where models like the NAM and CMC have it pass. This would bring the freezing line up into the coastal plain somewhere lending its slef to mixing with sleet, rain and possibly freezing rain depending on where your surface temps are siting.

You really need to look at the sounding though to check all levels of the mid levels for the warm nose.
As you can see first image is a sounding just east of my house. Black horizontal line represents where the atmosphere goes slight above freezing just below the 100mb mark or about 400feet above sea level. whereas the second sounding is one into Nassau county to my west. Temps throughout all are below freezing
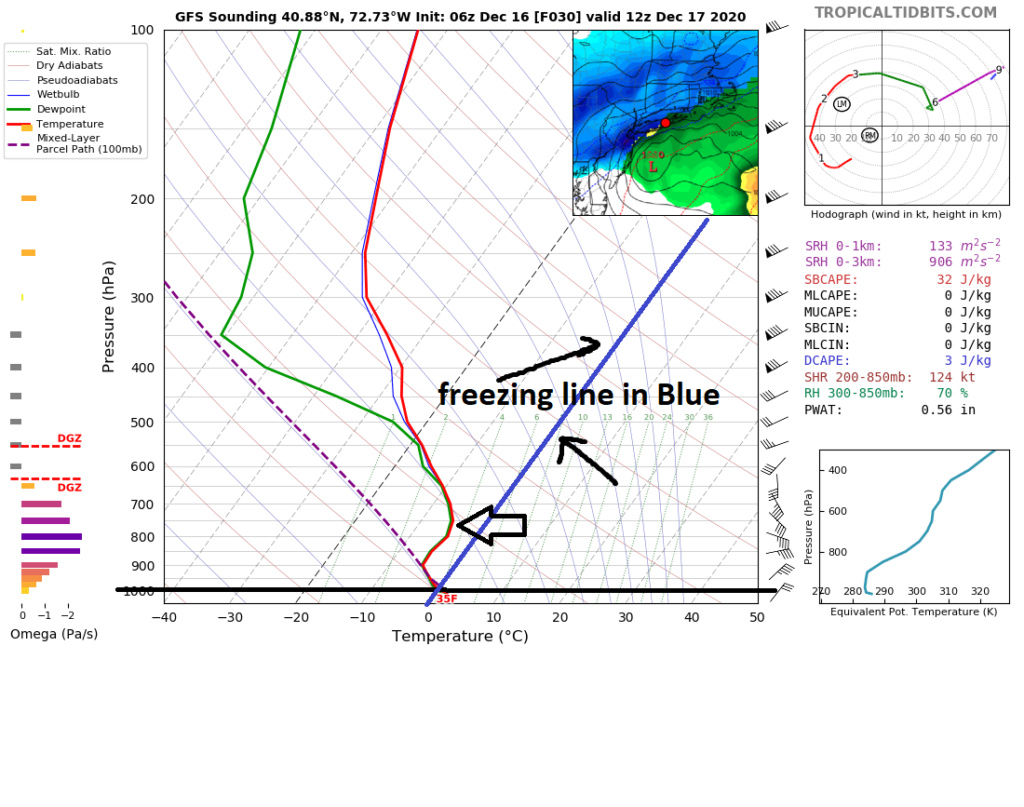
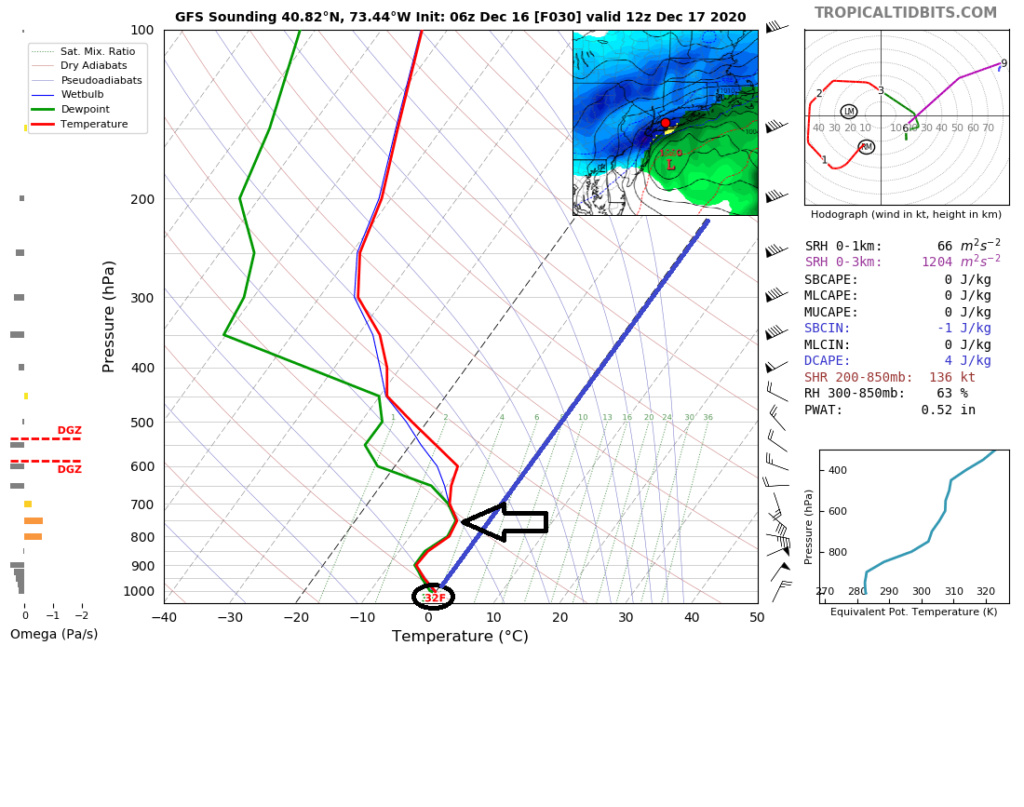
Withall due respect to you Ray but I think you may be underplaying the cold air. While others may be reading the results of a model output incorrectly verbatim I think it is well within reason to side with the models that have that subtle shift to the exact local of the mid level lows. Euro and GFS cont to hold steadfast in keeping 850 just south of LI. If true even the NS of LI will get close to if not exceed double digit totals. If nbot then the wam nose sneaks in and mixing holds down totals.
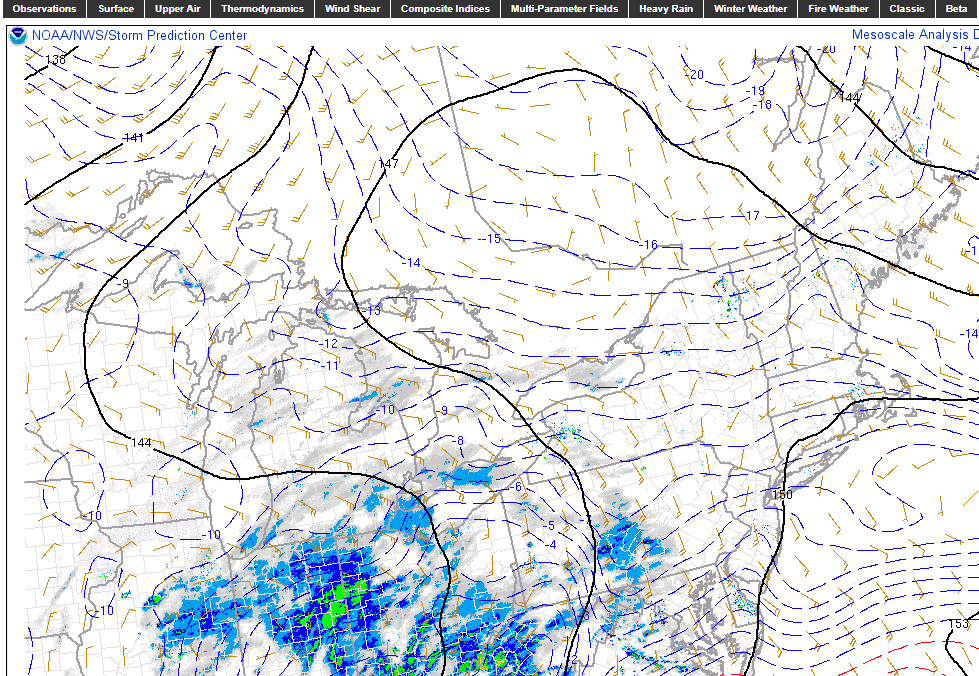
There is no doubt we have officially approached now cast time. I strongly urge people to go to this site today and tonight to monitor real time observations at the various levels. At the top of he page you can hover your mouse over change sector and click on the NE rectangle for a zoomed in version when we get to later this afternoon. Also hover over Upper Air and toggle through the 925, 850, and 700mb levels as we head into tonight to follow where there closed lows actually track. Trust me...if the track south of or just south of LI the coastal plain will stay white or mostly white. If its center is over NYC and LI then totals will be surpressed.
https://www.spc.noaa.gov/exper/mesoanalysis/new/viewsector.php?sector=19
sroc4- Admin

- Posts : 8354
Join date : 2013-01-07
mmanisca, rb924119, Grselig and SoulSingMG like this post
 Re: 12/16-12/17 Godzilla: Final Snow Map & Obsevations
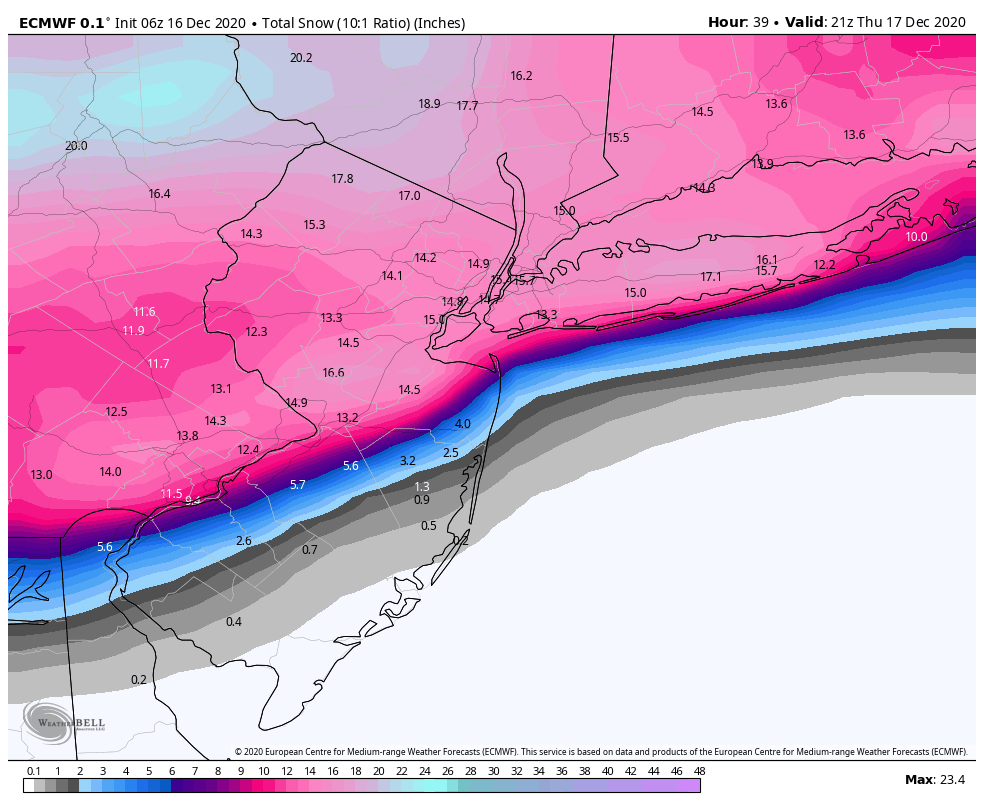
Based off trends this morning, it seems I would need to drag the higher snow totals on my map more SW. I’m going to give it a couple of hours before deciding...I need to wake up and look at the current observations. I keep coming back to this thought of dry slotting and fast moving storm which is main reason why I’m lower than what models suggest. However, the cut offs are insane and I don’t think that’s well represented on my map.
_________________
_______________________________________________________________________________________________________
CLICK HERE to view NJ Strong Snowstorm Classifications
rb924119 likes this post
 Re: 12/16-12/17 Godzilla: Final Snow Map & Obsevations
Pretty neat map. Shows the change in temperatures from previous run (euro). Look how much colder it got for parts of coastal NJ valid 7am, but the cold likely comes in earlier than that. I still think that area sees mixing and dry slotting issues, but something to watch


_________________
_______________________________________________________________________________________________________
CLICK HERE to view NJ Strong Snowstorm Classifications
 Re: 12/16-12/17 Godzilla: Final Snow Map & Obsevations
What does the HRRR show?. I have been trying to find it.

Joe Snow- Pro Enthusiast

- Posts : 924
Reputation : 7
Join date : 2014-02-12
Age : 62
Location : Sanford Florida, Fmrly Kings Park, NY
 Re: 12/16-12/17 Godzilla: Final Snow Map & Obsevations
LI is looking more and more like it is going to be in that 10-15 range...lets hope we get no mixing!
bloc1357- Pro Enthusiast

- Posts : 344
Reputation : 10
Join date : 2013-03-05
Age : 47
Location : West Babylon, NY - 11704
 Re: 12/16-12/17 Godzilla: Final Snow Map & Obsevations
Frank_Wx wrote:Pretty neat map. Shows the change in temperatures from previous run (euro). Look how much colder it got for parts of coastal NJ valid 7am, but the cold likely comes in earlier than that. I still think that area sees mixing and dry slotting issues, but something to watch
The cold air wants to hang tough with this
bloc1357- Pro Enthusiast

- Posts : 344
Reputation : 10
Join date : 2013-03-05
Age : 47
Location : West Babylon, NY - 11704
 Re: 12/16-12/17 Godzilla: Final Snow Map & Obsevations
Joe Snow wrote:What does the HRRR show?. I have been trying to find it.
https://www.tropicaltidbits.com/analysis/models/?model=hrrr®ion=neus&pkg=ref_frzn&runtime=2020121611&fh=17
11z only goes out 18 hours. The 12z will cover the whole duration but it’s not out yet on tidbits
_________________
_______________________________________________________________________________________________________
CLICK HERE to view NJ Strong Snowstorm Classifications
 Re: 12/16-12/17 Godzilla: Final Snow Map & Obsevations
_________________
_______________________________________________________________________________________________________
CLICK HERE to view NJ Strong Snowstorm Classifications
 Re: 12/16-12/17 Godzilla: Final Snow Map & Obsevations
Frank_Wx wrote:Joe Snow wrote:What does the HRRR show?. I have been trying to find it.
https://www.tropicaltidbits.com/analysis/models/?model=hrrr®ion=neus&pkg=ref_frzn&runtime=2020121611&fh=17
11z only goes out 18 hours. The 12z will cover the whole duration but it’s not out yet on tidbits
Just saw that, thanks Frank.........
I'll wait till the 12z Runs

Joe Snow- Pro Enthusiast

- Posts : 924
Reputation : 7
Join date : 2014-02-12
Age : 62
Location : Sanford Florida, Fmrly Kings Park, NY
 Re: 12/16-12/17 Godzilla: Final Snow Map & Obsevations
6z HREF


_________________
_______________________________________________________________________________________________________
CLICK HERE to view NJ Strong Snowstorm Classifications
 Re: 12/16-12/17 Godzilla: Final Snow Map & Obsevations
Frank_Wx wrote:6z HREF
I wish I knew what this meant: lol
Guest- Guest
 Re: 12/16-12/17 Godzilla: Final Snow Map & Obsevations
sroc4 wrote:billg315 wrote:It’s interesting because the 6z GFS tracks the Low over South Jersey and the 500mb seems to track over NWNJ/NEPA which is exactly what rb has been pointing out and what logically is not good news for us, but in its surface output stands fast to its 10-15” area-wide snowfall with little mixing. So I don’t know what to think. It does pick up that dry slotting that every model is now showing - and of course the one consistency in this thing is the dry slot is modeled right near or over my backyard.
500mb never closes off at least not until well past us. its 850 and 700mb closed low that you need to follow to see where the warmth and or dry slot will occur. GFS and Euro cont to insist that 850 is just to the south of LI.
This is 850: The positioning on the 6x GFS is such that it keeps the freezing line just south of LI, but as soon as it scoots by temps at this level crash further. The dashed line however is where models like the NAM and CMC have it pass. This would bring the freezing line up into the coastal plain somewhere lending its slef to mixing with sleet, rain and possibly freezing rain depending on where your surface temps are siting.
You really need to look at the sounding though to check all levels of the mid levels for the warm nose.
As you can see first image is a sounding just east of my house. Black horizontal line represents where the atmosphere goes slight above freezing just below the 100mb mark or about 400feet above sea level. whereas the second sounding is one into Nassau county to my west. Temps throughout all are below freezing
Withall due respect to you Ray but I think you may be underplaying the cold air. While others may be reading the results of a model output incorrectly verbatim I think it is well within reason to side with the models that have that subtle shift to the exact local of the mid level lows. Euro and GFS cont to hold steadfast in keeping 850 just south of LI. If true even the NS of LI will get close to if not exceed double digit totals. If nbot then the wam nose sneaks in and mixing holds down totals.
There is no doubt we have officially approached now cast time. I strongly urge people to go to this site today and tonight to monitor real time observations at the various levels. At the top of he page you can hover your mouse over change sector and click on the NE rectangle for a zoomed in version when we get to later this afternoon. Also hover over Upper Air and toggle through the 925, 850, and 700mb levels as we head into tonight to follow where there closed lows actually track. Trust me...if the track south of or just south of LI the coastal plain will stay white or mostly white. If its center is over NYC and LI then totals will be surpressed.
https://www.spc.noaa.gov/exper/mesoanalysis/new/viewsector.php?sector=19
Great analysis. Absolutely have to look at the soundings on this. 925's 850s may look fine, but it often times it'll be between 700-800 that burns you.
heehaw453- Advanced Forecaster

- Posts : 3906
Reputation : 86
Join date : 2014-01-20
Location : Bedminster Township, PA Elevation 600' ASL
 Re: 12/16-12/17 Godzilla: Final Snow Map & Obsevations
Rooster89 wrote:Frank_Wx wrote:6z HREF
I wish I knew what this meant: lol
Look at the color chart on the bottom for inches then look at the map if will give you an idea of what the model is predicting

Joe Snow- Pro Enthusiast

- Posts : 924
Reputation : 7
Join date : 2014-02-12
Age : 62
Location : Sanford Florida, Fmrly Kings Park, NY
 Re: 12/16-12/17 Godzilla: Final Snow Map & Obsevations
Frank_Wx wrote:Pretty neat map. Shows the change in temperatures from previous run (euro). Look how much colder it got for parts of coastal NJ valid 7am, but the cold likely comes in earlier than that. I still think that area sees mixing and dry slotting issues, but something to watch
At the lower levels of the atmosphere it'll be really hard to push that cold air out especially with a continuous supply of it. It'll be 700-800 that will have to watch on this one. Unfortunately I don't have any sites to see the near real time temps there. Any thoughts?
heehaw453- Advanced Forecaster

- Posts : 3906
Reputation : 86
Join date : 2014-01-20
Location : Bedminster Township, PA Elevation 600' ASL
 Re: 12/16-12/17 Godzilla: Final Snow Map & Obsevations
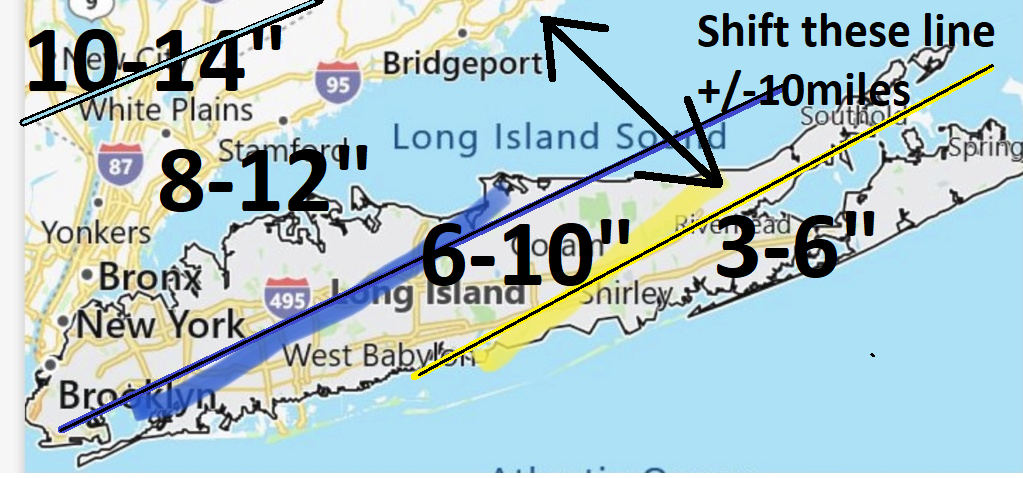
sroc4 wrote:Looks like 6zgfs came north a fair amount actually. Most other models tucked in again ever so slightly. The subtle winshsheuld wipers as Bernie would say seem to be in effect. Slide these lines left or right by 5-10miles and you have the difference between 3-6” SE of yellow. 6”10” between yellow and blue, and 8-12” NW of blue.
Im sticking with this map for LI except I am tipping the lines slightly more ENE than yesterday,
Last edited by sroc4 on Wed Dec 16, 2020 7:57 am; edited 1 time in total
_________________
"In weather and in life, there's no winning and losing; there's only winning and learning."
WINTER 2012/2013 TOTALS 43.65"WINTER 2017/2018 TOTALS 62.85" WINTER 2022/2023 TOTALS 4.9"
WINTER 2013/2014 TOTALS 64.85"WINTER 2018/2019 TOTALS 14.25" WINTER 2023/2024 TOTALS 13.1"
WINTER 2014/2015 TOTALS 71.20"WINTER 2019/2020 TOTALS 6.35"
WINTER 2015/2016 TOTALS 35.00"WINTER 2020/2021 TOTALS 37.75"
WINTER 2016/2017 TOTALS 42.25"WINTER 2021/2022 TOTALS 31.65"

sroc4- Admin

- Posts : 8354
Reputation : 302
Join date : 2013-01-07
Location : Wading River, LI
 Re: 12/16-12/17 Godzilla: Final Snow Map & Obsevations
_________________
-Alex Iannone-

aiannone- Senior Enthusiast - Mod

- Posts : 4815
Reputation : 92
Join date : 2013-01-07
Location : Saint James, LI (Northwest Suffolk Co.)
bloc1357 likes this post
heehaw453- Advanced Forecaster

- Posts : 3906
Reputation : 86
Join date : 2014-01-20
Location : Bedminster Township, PA Elevation 600' ASL

Joe Snow- Pro Enthusiast

- Posts : 924
Reputation : 7
Join date : 2014-02-12
Age : 62
Location : Sanford Florida, Fmrly Kings Park, NY
bloc1357 and jaydoy like this post
 Re: 12/16-12/17 Godzilla: Final Snow Map & Obsevations
I'm 23.5/8.5 now. That is a seriously nice overrunning surface.
heehaw453- Advanced Forecaster

- Posts : 3906
Reputation : 86
Join date : 2014-01-20
Location : Bedminster Township, PA Elevation 600' ASL
 Re: 12/16-12/17 Godzilla: Final Snow Map & Obsevations
_________________
"In weather and in life, there's no winning and losing; there's only winning and learning."
WINTER 2012/2013 TOTALS 43.65"WINTER 2017/2018 TOTALS 62.85" WINTER 2022/2023 TOTALS 4.9"
WINTER 2013/2014 TOTALS 64.85"WINTER 2018/2019 TOTALS 14.25" WINTER 2023/2024 TOTALS 13.1"
WINTER 2014/2015 TOTALS 71.20"WINTER 2019/2020 TOTALS 6.35"
WINTER 2015/2016 TOTALS 35.00"WINTER 2020/2021 TOTALS 37.75"
WINTER 2016/2017 TOTALS 42.25"WINTER 2021/2022 TOTALS 31.65"

sroc4- Admin

- Posts : 8354
Reputation : 302
Join date : 2013-01-07
Location : Wading River, LI
 Re: 12/16-12/17 Godzilla: Final Snow Map & Obsevations
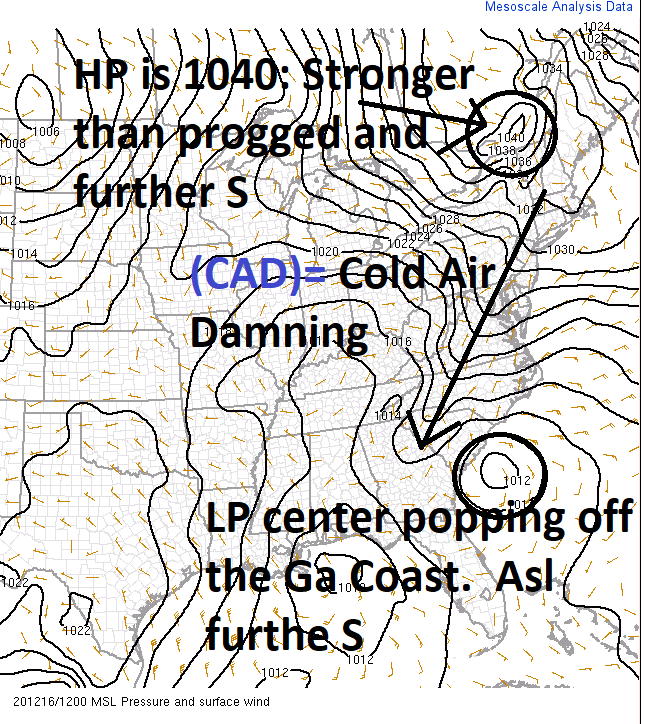
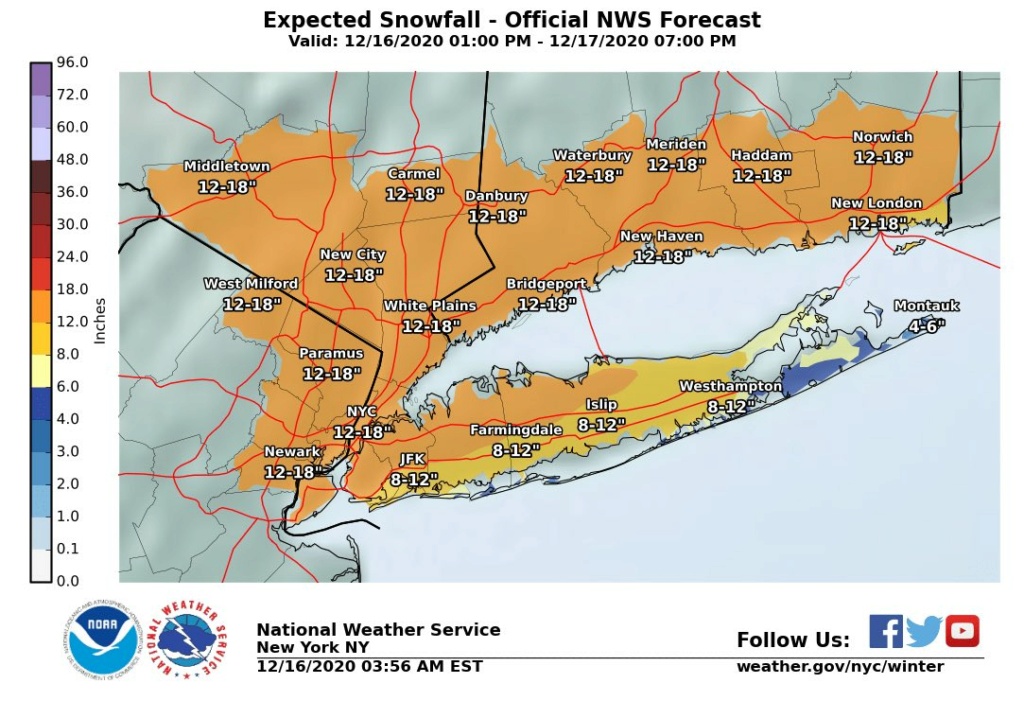
Upton’s UP! Just walk outside, guys. What does that airmass feel like to you? When I walked my dog at 2am, I thought, “NOPE. This damming ain’t playing.” Sometimes we’ve just gotta get back to basics; time for good ole obs at this point. City/most of LI is gonna rock n roll with incredible snowfall rates after 4-5pm. Let’s go!

Last edited by SoulSingMG on Wed Dec 16, 2020 8:08 am; edited 1 time in total

SoulSingMG- Senior Enthusiast

- Posts : 2853
Reputation : 74
Join date : 2013-12-11
Location : Long Island City, NY
 Re: 12/16-12/17 Godzilla: Final Snow Map & Obsevations
I’ll try to keep my imby ramblings to a minimum here, but SROC, would a stronger, more south hp be able to save this for the Jersey Shore, or nah I’m just cooked on this one? Just 25-50 miles more SE is all I need. Ahhhh!
SENJsnowman- Senior Enthusiast

- Posts : 1189
Reputation : 61
Join date : 2017-01-06
Age : 51
Location : Bayville, NJ

nutleyblizzard- Senior Enthusiast

- Posts : 1954
Reputation : 41
Join date : 2014-01-30
Age : 58
Location : Nutley, new jersey
bloc1357- Pro Enthusiast

- Posts : 344
Reputation : 10
Join date : 2013-03-05
Age : 47
Location : West Babylon, NY - 11704
 Re: 12/16-12/17 Godzilla: Final Snow Map & Obsevations
SENJsnowman wrote:I’ll try to keep my imby ramblings to a minimum here, but SROC, would a stronger, more south hp be able to save this for the Jersey Shore, or nah I’m just cooked on this one? Just 25-50 miles more SE is all I need. Ahhhh!
It might for sure. But Saved needs to be defined. You are pretty far south.
_________________
"In weather and in life, there's no winning and losing; there's only winning and learning."
WINTER 2012/2013 TOTALS 43.65"WINTER 2017/2018 TOTALS 62.85" WINTER 2022/2023 TOTALS 4.9"
WINTER 2013/2014 TOTALS 64.85"WINTER 2018/2019 TOTALS 14.25" WINTER 2023/2024 TOTALS 13.1"
WINTER 2014/2015 TOTALS 71.20"WINTER 2019/2020 TOTALS 6.35"
WINTER 2015/2016 TOTALS 35.00"WINTER 2020/2021 TOTALS 37.75"
WINTER 2016/2017 TOTALS 42.25"WINTER 2021/2022 TOTALS 31.65"

sroc4- Admin

- Posts : 8354
Reputation : 302
Join date : 2013-01-07
Location : Wading River, LI
 Re: 12/16-12/17 Godzilla: Final Snow Map & Obsevations
Why do I have to live in belford NJ where every line ever drawn on a snow map has to be? Lol
Guest- Guest
Page 2 of 32 •  1, 2, 3 ... 17 ... 32
Page 2 of 32
Permissions in this forum:
You cannot reply to topics in this forum
 Home
Home
