
 Search
Coastal Storm Observations/Discssions October 10th-13th
+3
Quietace
sroc4
Frank_Wx
7 posters
Page 3 of 3 •  1, 2, 3
Re: Coastal Storm Observations/Discssions October 10th-13th
![]() by amugs Fri Oct 11, 2013 10:02 am
by amugs Fri Oct 11, 2013 10:02 am
We can only hope Doc and I heard this on two other news stations - it fooled all the major mets! Another curveball from Mother Nature.
amugs- Advanced Forecaster - Mod

- Posts : 15093
Join date : 2013-01-07
Re: Coastal Storm Observations/Discssions October 10th-13th
![]() by Frank_Wx Fri Oct 11, 2013 3:16 pm
by Frank_Wx Fri Oct 11, 2013 3:16 pm
I'm disappointed in myself for not studying the upper level pattern closer with this storm. Clearly with a High to the north and all the dry air in the Atlantic this year, the rain would not develop as models showed because the 600-900mb levels are dry. Further, another storm in the Atlantic was robbing this storm of energy. Oh well, you take and learn from it. Off to the next one.
Although parts of SNJ have 3+ inches of rain.
Although parts of SNJ have 3+ inches of rain.
Frank_Wx- Godzilla Seeker

- Posts : 21305
Join date : 2013-01-05 -

Re: Coastal Storm Observations/Discssions October 10th-13th
![]() by Quietace Fri Oct 11, 2013 5:23 pm
by Quietace Fri Oct 11, 2013 5:23 pm
We got caught model hugging badly with this one. As you said learn and move onFrank_Wx wrote:I'm disappointed in myself for not studying the upper level pattern closer with this storm. Clearly with a High to the north and all the dry air in the Atlantic this year, the rain would not develop as models showed because the 600-900mb levels are dry. Further, another storm in the Atlantic was robbing this storm of energy. Oh well, you take and learn from it. Off to the next one.
Although parts of SNJ have 3+ inches of rain.

Quietace- Meteorologist - Mod

- Posts : 3687
Reputation : 33
Join date : 2013-01-07
Age : 27
Location : Point Pleasant, NJ
Re: Coastal Storm Observations/Discssions October 10th-13th
![]() by Quietace Fri Oct 11, 2013 5:23 pm
by Quietace Fri Oct 11, 2013 5:23 pm
Through i have had pretty heavy rain all day today. Just close enough to the band of convection today.
Quietace- Meteorologist - Mod
- Posts : 3687
Reputation : 33
Join date : 2013-01-07
Age : 27
Location : Point Pleasant, NJ
Re: Coastal Storm Observations/Discssions October 10th-13th
![]() by docstox12 Sat Oct 12, 2013 8:28 am
by docstox12 Sat Oct 12, 2013 8:28 am
Barely a few sprinkles up here the last few days.Reminds me of that winter storm a few years ago that blasted Southern Jersey with 20 or more inches while we up here did not see a flake!Quietace wrote:Through i have had pretty heavy rain all day today. Just close enough to the band of convection today.

docstox12- Wx Statistician Guru

- Posts : 8504
Reputation : 222
Join date : 2013-01-07
Age : 73
Location : Monroe NY
Re: Coastal Storm Observations/Discssions October 10th-13th
![]() by sroc4 Sun Oct 13, 2013 8:30 am
by sroc4 Sun Oct 13, 2013 8:30 am
So huge bust along the northern half of NJ and all of LI right? The precip maps on Wed for pretty much all the major models had as much as 1-5" of rain for these areas by this time. So what exactly happened? Frank posted above stating that the HP to the North, the dry air, and the other storm in the Atlantic were to blame.
As Thursday was unfolding and I woke up on Friday (the day the majority of moisture for me on LI was supposed to fall) it was clear to me on satellite imagery as to why coastal and northern areas busted. The HP to the north, and dry air were tiny players IMO. The main driving force behind the physics of the bust was the second LP that developed well OTS east of the one we were focused on off the Delmarva coast.
If you go back to Oct 6th in the Oct Observation thread I posted a blog discussing the known bias' of the different models and what they were showing as a soln at the time for this system. Well low and behold the GFS actually had this thing pretty much pegged on Oct 6th. Here is a quote from that blog.
" Here is hr 108. Notice how the energy is trying to focus off the NC coast, but pay attention to the area of moisture to the NE of the focus of energy. As time goes by the GFS eventually kicks out that piece of energy north and east and leaves behind a much weaker system off the coast. As a result this weaker system gets influenced by the blocking to the north. It actually retrogrades the energy back to the coast before actually heading south to just off the SC coast before eventually getting picked up by a front and NE OTS. IMO the bias of this model makes this soln unlikely a this time, because a weaker system will be more heavily influenced by the blocking building back in effectively pushing it south like the model run shows, however, if you keep all the energy as one entity instead of kicking out a piece of it would lead to a stronger system which would come further north"
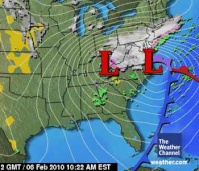
So the main reason there was this bust area was due to divergence. Let me explain. Look at the water vapor imagery from Friday morning.

HP to the north, LP off the Delmarva, and LP OTS creating a triangle if you will. The X is the areas that busted. Now as you all should know air moves from areas of HP to areas of LP. Clockwise around HP and Counterclockwise around LP. The developing LP OTS does two main things. First which can be clearly seen on satellite is it diverts the tropical moisture feed OTS and into the LP that is OTS. The northern edge of the cold front is more associated with the LP OTS rather than the one off the coast effectively cutting off the tropical moisture feed to the coast. That being said; however, despite the fact that you can see dry air in the SE CONUS that looks like it is being pumped up the coast the precipitable water values, and relative humidity in the areas that "busted" were still plenty high to support steady rain Thursday through Sat both on the surface maps and at 700mb. Unfort I did not save those maps. So the dry air really should not have been that big a player. For those who do not know precipitable water values measure the total atmospheric water vapor contained in a vertical column of unit of air cross-sectional area extending between any two specified levels.
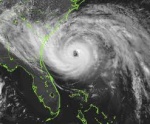
The second and main reason the LP OTS affected this system brings me back to the term divergence and back to the triangle formed by the two LP's and the HP to the north. This next satellite image is the rainbow infrared imagery which shows convection. Convection is where air converges and is forced upwards. The darker the yellows, oranges, and reds on this image the more convection (rising air). Remember when air rises it cools; when it cools the water contained within it condenses forming clouds and rain.

Now look at the area I have circled. Although the 2 areas of LP where relatively weak (1008-1010mb) the area between the two LP's has/is higher pressure relative to the centers of the two LP's. The air in the center effectively diverges heading for the LP center off the Delmarva coast, and some of the air moving towards the LP center OTS. As air diverges it is replaced with sinking air from above. The divergence in the area I have circled effectively squashed any chance for the atmosphere to "ring out" despite high relative humidity and precipitable water values in that area.
If there is no LP OTS the frontal boundary is attached to the LP off the Coast, the tropical moisture feed pumps in lots of moisture, and there is nothing but convergence in the area circled. This type of "bust zone" is highly reminisant of all the Miller B type setups we had last winter where SE Pa area seemed to be surrounded by higher snow totals and they "busted". As the LP from the southern and northern branches were beginning to phase the area between the two LP's had that same area of divergence.
As Thursday was unfolding and I woke up on Friday (the day the majority of moisture for me on LI was supposed to fall) it was clear to me on satellite imagery as to why coastal and northern areas busted. The HP to the north, and dry air were tiny players IMO. The main driving force behind the physics of the bust was the second LP that developed well OTS east of the one we were focused on off the Delmarva coast.
If you go back to Oct 6th in the Oct Observation thread I posted a blog discussing the known bias' of the different models and what they were showing as a soln at the time for this system. Well low and behold the GFS actually had this thing pretty much pegged on Oct 6th. Here is a quote from that blog.
" Here is hr 108. Notice how the energy is trying to focus off the NC coast, but pay attention to the area of moisture to the NE of the focus of energy. As time goes by the GFS eventually kicks out that piece of energy north and east and leaves behind a much weaker system off the coast. As a result this weaker system gets influenced by the blocking to the north. It actually retrogrades the energy back to the coast before actually heading south to just off the SC coast before eventually getting picked up by a front and NE OTS. IMO the bias of this model makes this soln unlikely a this time, because a weaker system will be more heavily influenced by the blocking building back in effectively pushing it south like the model run shows, however, if you keep all the energy as one entity instead of kicking out a piece of it would lead to a stronger system which would come further north"
So the main reason there was this bust area was due to divergence. Let me explain. Look at the water vapor imagery from Friday morning.
HP to the north, LP off the Delmarva, and LP OTS creating a triangle if you will. The X is the areas that busted. Now as you all should know air moves from areas of HP to areas of LP. Clockwise around HP and Counterclockwise around LP. The developing LP OTS does two main things. First which can be clearly seen on satellite is it diverts the tropical moisture feed OTS and into the LP that is OTS. The northern edge of the cold front is more associated with the LP OTS rather than the one off the coast effectively cutting off the tropical moisture feed to the coast. That being said; however, despite the fact that you can see dry air in the SE CONUS that looks like it is being pumped up the coast the precipitable water values, and relative humidity in the areas that "busted" were still plenty high to support steady rain Thursday through Sat both on the surface maps and at 700mb. Unfort I did not save those maps. So the dry air really should not have been that big a player. For those who do not know precipitable water values measure the total atmospheric water vapor contained in a vertical column of unit of air cross-sectional area extending between any two specified levels.
The second and main reason the LP OTS affected this system brings me back to the term divergence and back to the triangle formed by the two LP's and the HP to the north. This next satellite image is the rainbow infrared imagery which shows convection. Convection is where air converges and is forced upwards. The darker the yellows, oranges, and reds on this image the more convection (rising air). Remember when air rises it cools; when it cools the water contained within it condenses forming clouds and rain.
Now look at the area I have circled. Although the 2 areas of LP where relatively weak (1008-1010mb) the area between the two LP's has/is higher pressure relative to the centers of the two LP's. The air in the center effectively diverges heading for the LP center off the Delmarva coast, and some of the air moving towards the LP center OTS. As air diverges it is replaced with sinking air from above. The divergence in the area I have circled effectively squashed any chance for the atmosphere to "ring out" despite high relative humidity and precipitable water values in that area.
If there is no LP OTS the frontal boundary is attached to the LP off the Coast, the tropical moisture feed pumps in lots of moisture, and there is nothing but convergence in the area circled. This type of "bust zone" is highly reminisant of all the Miller B type setups we had last winter where SE Pa area seemed to be surrounded by higher snow totals and they "busted". As the LP from the southern and northern branches were beginning to phase the area between the two LP's had that same area of divergence.
_________________
"In weather and in life, there's no winning and losing; there's only winning and learning."
WINTER 2012/2013 TOTALS 43.65"WINTER 2017/2018 TOTALS 62.85" WINTER 2022/2023 TOTALS 4.9"
WINTER 2013/2014 TOTALS 64.85"WINTER 2018/2019 TOTALS 14.25" WINTER 2023/2024 TOTALS 13.1"
WINTER 2014/2015 TOTALS 71.20"WINTER 2019/2020 TOTALS 6.35"
WINTER 2015/2016 TOTALS 35.00"WINTER 2020/2021 TOTALS 37.75"
WINTER 2016/2017 TOTALS 42.25"WINTER 2021/2022 TOTALS 31.65"

sroc4- Admin
- Posts : 8331
Reputation : 301
Join date : 2013-01-07
Location : Wading River, LI
Re: Coastal Storm Observations/Discssions October 10th-13th
![]() by amugs Sun Oct 13, 2013 8:35 am
by amugs Sun Oct 13, 2013 8:35 am
Excellent analysis roc, very well stated in lay men's terms - easy to read and follow. Like you said on Oct 6th, the storm wouldn't be.
Off to pick apples and pumpkins in Warwick, NY!
Off to pick apples and pumpkins in Warwick, NY!
amugs- Advanced Forecaster - Mod
- Posts : 15093
Reputation : 213
Join date : 2013-01-07
Age : 54
Location : Hillsdale,NJ
Re: Coastal Storm Observations/Discssions October 10th-13th
![]() by Dunnzoo Sun Oct 13, 2013 2:42 pm
by Dunnzoo Sun Oct 13, 2013 2:42 pm
Great stuff roc, I knew there had to be more to it, since the gfs is usually out to lunch and this time it was more accurate than the others...it saw something the other models didn't...good learning moment for me for sure...
_________________
Janet
Snowfall winter of 2023-2024 17.5"
Snowfall winter of 2022-2023 6.0"
Snowfall winter of 2021-2022 17.6" 1" sleet 2/25/22
Snowfall winter of 2020-2021 51.1"
Snowfall winter of 2019-2020 8.5"
Snowfall winter of 2018-2019 25.1"
Snowfall winter of 2017-2018 51.9"
Snowfall winter of 2016-2017 45.6"
Snowfall winter of 2015-2016 29.5"
Snowfall winter of 2014-2015 50.55"
Snowfall winter of 2013-2014 66.5"
Dunnzoo- Senior Enthusiast - Mod
- Posts : 4891
Reputation : 68
Join date : 2013-01-11
Age : 62
Location : Westwood, NJ
Re: Coastal Storm Observations/Discssions October 10th-13th
![]() by sroc4 Sun Oct 13, 2013 4:55 pm
by sroc4 Sun Oct 13, 2013 4:55 pm
You and me both Dunn. Mugs I was fooled just like most everyone else. I thought what the gfs was showing last week was a product of it bias. I'll tell you what though watch for these divergence zones in between the phasing LPs during miller B setups this winter.Dunnzoo wrote:Great stuff roc, I knew there had to be more to it, since the gfs is usually out to lunch and this time it was more accurate than the others...it saw something the other models didn't...good learning moment for me for sure...
_________________
"In weather and in life, there's no winning and losing; there's only winning and learning."
WINTER 2012/2013 TOTALS 43.65"WINTER 2017/2018 TOTALS 62.85" WINTER 2022/2023 TOTALS 4.9"
WINTER 2013/2014 TOTALS 64.85"WINTER 2018/2019 TOTALS 14.25" WINTER 2023/2024 TOTALS 13.1"
WINTER 2014/2015 TOTALS 71.20"WINTER 2019/2020 TOTALS 6.35"
WINTER 2015/2016 TOTALS 35.00"WINTER 2020/2021 TOTALS 37.75"
WINTER 2016/2017 TOTALS 42.25"WINTER 2021/2022 TOTALS 31.65"
sroc4- Admin
- Posts : 8331
Reputation : 301
Join date : 2013-01-07
Location : Wading River, LI
Page 3 of 3 • 1, 2, 3
Permissions in this forum:
You cannot reply to topics in this forum|
|
|