May 2018 Observations & Discussions
+24
aiannone
jimv45
SoulSingMG
bluebythec
billg315
ak926
Quietace
sroc4
jmanley32
rb924119
Math23x7
weatherwatchermom
Vinnydula
Radz
1190ftalt
Grselig
Dunnzoo
Dtone
frank 638
dkodgis
Snow88
amugs
skinsfan1177
Frank_Wx
28 posters
Page 5 of 7 •  1, 2, 3, 4, 5, 6, 7
 Re: May 2018 Observations & Discussions
Just got off phone with my uncle in Pine Bush NY and he said no power trees uprooted everywhere
skinsfan1177- Senior Enthusiast

- Posts : 4485
Join date : 2013-01-07
 Re: May 2018 Observations & Discussions
Check out the Damage in Hamden CT from the storms yesterday...impressive
https://twitter.com/twitter/statuses/996704261617733632
https://twitter.com/twitter/statuses/996704261617733632
sroc4- Admin

- Posts : 8354
Join date : 2013-01-07
 Re: May 2018 Observations & Discussions
The director of operations for the local utility company told a friend there can be no school tomorrow and most likely not Fri due to the electric infrastructure being broken, smashed by the storm. I went out today and checked out the action a few miles away from home. It was bracing stuff. Big trees, old growth, snapped here there everywhere. Garages, sheds, down. Trees on houses. Everyone up here has wells so whoever is home is losing food out of the fridge, and no water. It was a major league spanking across the area to be sure. I see Sullivan County, and parts of CT also got stomped. Yorktown Heights in Westchester has no electric and so many other places are out of electric. The paper says 75,000 are out today. Tornadoes for sure but I think there was a derecho. I have seen one before, very focused damage across miles and only just so wide. Like a lawnmower cutting a swath. We were lucky. Everyone else, no.

dkodgis- Senior Enthusiast

- Posts : 2560
Reputation : 98
Join date : 2013-12-29
 Re: May 2018 Observations & Discussions
Impressive tornado evidence north of New Haven
NY Mesonet network picked up some decent gusts
Brewster 65 mph
Bronx (Lehman College) 59 mph
Manhattan (Hunter College) 56 mph
Queens (Queens College) 57 mph
Look at this damage. #Hamden #Connecticut near Sleeping Giant State Park! Attention @NWSNewYorkNY Thank you @WTNH photographer Joe D! pic.twitter.com/fXZlQRVhpL
— Gil Simmons (@gilsimmons) May 16, 2018
NY Mesonet network picked up some decent gusts
Brewster 65 mph
Bronx (Lehman College) 59 mph
Manhattan (Hunter College) 56 mph
Queens (Queens College) 57 mph
Dtone- Wx Statistician Guru

- Posts : 1738
Reputation : 9
Join date : 2013-08-26
Location : Bronx, NY
 Re: May 2018 Observations & Discussions
Interesting article on the meteotsunami that occurred yesterday
http://www.nj.com/weather/index.ssf/2018/05/rare_tsunami_hits_nj_jersey_shore_meteotsunami_con.html
http://www.nj.com/weather/index.ssf/2018/05/rare_tsunami_hits_nj_jersey_shore_meteotsunami_con.html
deblanka- Posts : 8
Reputation : 1
Join date : 2013-12-31
 Re: May 2018 Observations & Discussions
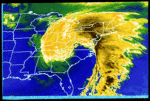
Storm preliminary survey results:
https://www.weather.gov/okx/StormSurveys
https://www.weather.gov/okx/StormSurveys
Radz- Pro Enthusiast

- Posts : 1028
Reputation : 17
Join date : 2013-01-12
Location : Cortlandt Manor NY
 Re: May 2018 Observations & Discussions
Scott and Soul, I just wanted to let you know that I didn't forget about you, and wanted to thank you both for the shoutouts a little while back. I really wish that I could have put together a video for everybody, though, because i think it will turn out to be a great learning tool for all of us. Anyway, I wonder how long it will be now before other outlets start discussing the "potential" now that the EURO just did what it did, and EVERY model now has a system? Lmaoooo I also wish Ryan could be around more so we could continue that discussion, but he's a busy man haha fun times ahead!!
rb924119- Meteorologist

- Posts : 6928
Reputation : 194
Join date : 2013-02-06
Age : 32
Location : Greentown, Pa
 Re: May 2018 Observations & Discussions
This weather sucks rain today until Sunday
frank 638- Senior Enthusiast

- Posts : 2843
Reputation : 37
Join date : 2016-01-01
Age : 40
Location : bronx ny
 Re: May 2018 Observations & Discussions
Dynamics Final today and then I am done with undergrad...Give me a day or tworb924119 wrote:Scott and Soul, I just wanted to let you know that I didn't forget about you, and wanted to thank you both for the shoutouts a little while back. I really wish that I could have put together a video for everybody, though, because i think it will turn out to be a great learning tool for all of us. Anyway, I wonder how long it will be now before other outlets start discussing the "potential" now that the EURO just did what it did, and EVERY model now has a system? Lmaoooo I also wish Ryan could be around more so we could continue that discussion, but he's a busy man haha fun times ahead!!

Quietace- Meteorologist - Mod

- Posts : 3689
Reputation : 33
Join date : 2013-01-07
Age : 27
Location : Point Pleasant, NJ
 Re: May 2018 Observations & Discussions
Quietace wrote:Dynamics Final today and then I am done with undergrad...Give me a day or tworb924119 wrote:Scott and Soul, I just wanted to let you know that I didn't forget about you, and wanted to thank you both for the shoutouts a little while back. I really wish that I could have put together a video for everybody, though, because i think it will turn out to be a great learning tool for all of us. Anyway, I wonder how long it will be now before other outlets start discussing the "potential" now that the EURO just did what it did, and EVERY model now has a system? Lmaoooo I also wish Ryan could be around more so we could continue that discussion, but he's a busy man haha fun times ahead!!
I’m looking forward to sitting back and reading the discussion between you two with a cup of coffee. Ryan. Good luck with your final. Ray. How’s the project coming along?
_________________
"In weather and in life, there's no winning and losing; there's only winning and learning."
WINTER 2012/2013 TOTALS 43.65"WINTER 2017/2018 TOTALS 62.85" WINTER 2022/2023 TOTALS 4.9"
WINTER 2013/2014 TOTALS 64.85"WINTER 2018/2019 TOTALS 14.25" WINTER 2023/2024 TOTALS 13.1"
WINTER 2014/2015 TOTALS 71.20"WINTER 2019/2020 TOTALS 6.35"
WINTER 2015/2016 TOTALS 35.00"WINTER 2020/2021 TOTALS 37.75"
WINTER 2016/2017 TOTALS 42.25"WINTER 2021/2022 TOTALS 31.65"

sroc4- Admin

- Posts : 8354
Reputation : 302
Join date : 2013-01-07
Location : Wading River, LI
 Re: May 2018 Observations & Discussions
Another beautiful spring day out there!!! .
57 and raining lovely!!
57 and raining lovely!!
_________________
Mugs
AKA:King: Snow Weenie
Self Proclaimed
WINTER 2014-15 : 55.12" +.02 for 6 coatings (avg. 35")
WINTER 2015-16 Total - 29.8" (Avg 35")
WINTER 2016-17 : 39.5" so far
amugs- Advanced Forecaster - Mod

- Posts : 15095
Reputation : 213
Join date : 2013-01-07
Age : 54
Location : Hillsdale,NJ
 Re: May 2018 Observations & Discussions
Worst. Spring. Ever.

nutleyblizzard- Senior Enthusiast

- Posts : 1954
Reputation : 41
Join date : 2014-01-30
Age : 58
Location : Nutley, new jersey
 Re: May 2018 Observations & Discussions
May showers bring June flowers

dkodgis- Senior Enthusiast

- Posts : 2560
Reputation : 98
Join date : 2013-12-29
 Re: May 2018 Observations & Discussions
nutleyblizzard wrote:Worst. Spring. Ever.
As opposed to all the other "Worst. Spring. Ever." posts over the years?
Math23x7- Wx Statistician Guru

- Posts : 2379
Reputation : 68
Join date : 2013-01-08
 Re: May 2018 Observations & Discussions
There was def a derecho I witnessed it blast through my area went to a big open parking lot it came like along running army line and slam. Not a ton of outages in yonkers a few thousand I thing but a ton of tree damage.

jmanley32- Senior Enthusiast

- Posts : 20535
Reputation : 108
Join date : 2013-12-12
Age : 43
Location : Yonkers, NY
 Re: May 2018 Observations & Discussions
Quietace wrote:Dynamics Final today and then I am done with undergrad...Give me a day or tworb924119 wrote:Scott and Soul, I just wanted to let you know that I didn't forget about you, and wanted to thank you both for the shoutouts a little while back. I really wish that I could have put together a video for everybody, though, because i think it will turn out to be a great learning tool for all of us. Anyway, I wonder how long it will be now before other outlets start discussing the "potential" now that the EURO just did what it did, and EVERY model now has a system? Lmaoooo I also wish Ryan could be around more so we could continue that discussion, but he's a busy man haha fun times ahead!!
Dynamics?!!! I LOVED DYNAMICS!!! QG Theory, Sutcliffe Development Theory, Q-vectors, etc.....YES YES YESSSSSS!!!!!!!!!! Good luck, buddy!!! Can't wait to hear you say (or, read, I guess lmao) how well you did!!! And no worries, bud; we ALL understand what finals are like ahaha
Scott, my end of it is done. 100%. It's been beta-tested, well, partially, and it works amazingly. Gotta wait for my friend to finish his end of it before we can really test the whole thing as a unit, but in the meantime, I'm keeping busy with some additional aspects. I have a few minor updates that I'm going to add over the summer, most likely, and a few questions that I will likely have answered either next week or the following. Either way, it's technically operational now and would do just fine, but the "over the top" part is still in progress. Definitely is everything I wanted to accomplish and more so far, so I can't wait to see how my friend's end turns out!!! Believe me when I tell you that it's taking everything I have to not reveal everything I have so far ahaha but when it drops, it's gonna drop with a bang haha
rb924119- Meteorologist

- Posts : 6928
Reputation : 194
Join date : 2013-02-06
Age : 32
Location : Greentown, Pa
 Re: May 2018 Observations & Discussions
rb924119 wrote:Quietace wrote:Dynamics Final today and then I am done with undergrad...Give me a day or tworb924119 wrote:Scott and Soul, I just wanted to let you know that I didn't forget about you, and wanted to thank you both for the shoutouts a little while back. I really wish that I could have put together a video for everybody, though, because i think it will turn out to be a great learning tool for all of us. Anyway, I wonder how long it will be now before other outlets start discussing the "potential" now that the EURO just did what it did, and EVERY model now has a system? Lmaoooo I also wish Ryan could be around more so we could continue that discussion, but he's a busy man haha fun times ahead!!
Dynamics?!!! I LOVED DYNAMICS!!! QG Theory, Sutcliffe Development Theory, Q-vectors, etc.....YES YES YESSSSSS!!!!!!!!!! Good luck, buddy!!! Can't wait to hear you say (or, read, I guess lmao) how well you did!!! And no worries, bud; we ALL understand what finals are like ahaha
Scott, my end of it is done. 100%. It's been beta-tested, well, partially, and it works amazingly. Gotta wait for my friend to finish his end of it before we can really test the whole thing as a unit, but in the meantime, I'm keeping busy with some additional aspects. I have a few minor updates that I'm going to add over the summer, most likely, and a few questions that I will likely have answered either next week or the following. Either way, it's technically operational now and would do just fine, but the "over the top" part is still in progress. Definitely is everything I wanted to accomplish and more so far, so I can't wait to see how my friend's end turns out!!! Believe me when I tell you that it's taking everything I have to not reveal everything I have so far ahaha but when it drops, it's gonna drop with a bang haha
DUDE!!!!!!

In all seriousness Im looking forward to the big reveal. Also Check your PM
_________________
"In weather and in life, there's no winning and losing; there's only winning and learning."
WINTER 2012/2013 TOTALS 43.65"WINTER 2017/2018 TOTALS 62.85" WINTER 2022/2023 TOTALS 4.9"
WINTER 2013/2014 TOTALS 64.85"WINTER 2018/2019 TOTALS 14.25" WINTER 2023/2024 TOTALS 13.1"
WINTER 2014/2015 TOTALS 71.20"WINTER 2019/2020 TOTALS 6.35"
WINTER 2015/2016 TOTALS 35.00"WINTER 2020/2021 TOTALS 37.75"
WINTER 2016/2017 TOTALS 42.25"WINTER 2021/2022 TOTALS 31.65"

sroc4- Admin

- Posts : 8354
Reputation : 302
Join date : 2013-01-07
Location : Wading River, LI
 Re: May 2018 Observations & Discussions
GFS!!!! GFS!!!!! GFS!!!!!!!
rb924119- Meteorologist

- Posts : 6928
Reputation : 194
Join date : 2013-02-06
Age : 32
Location : Greentown, Pa
 Re: May 2018 Observations & Discussions
rb924119 wrote:GFS!!!! GFS!!!!! GFS!!!!!!!
300 hours out

Snow88- Senior Enthusiast

- Posts : 2193
Reputation : 4
Join date : 2013-01-09
Age : 35
Location : Brooklyn, NY
 Re: May 2018 Observations & Discussions
Snow88 wrote:rb924119 wrote:GFS!!!! GFS!!!!! GFS!!!!!!!
300 hours out
But at least we have development on ALL globals now around Days 6-9. That's the part that maters to me right now, but I always love watching the GFS be stupid ahaha though, it's solution is not entirely out of the realm of possibilities lol just pretty unlikely IMO.
rb924119- Meteorologist

- Posts : 6928
Reputation : 194
Join date : 2013-02-06
Age : 32
Location : Greentown, Pa
 Re: May 2018 Observations & Discussions
How can anybody be excited about this pattern or models. This is ridiculous. All outdoor activities have been cancelled for practically this entire month. I would love to know what our precipitation totals are year-to-date and how they compare to records. So tired of waking up to rain and cool temperatures, especially on the weekends. Sorry, just had to vent.
Fededle22- Posts : 169
Reputation : 2
Join date : 2013-03-08
Location : West Orange, NJ
 Re: May 2018 Observations & Discussions
So Ray, aka rb, posted about J. Bastardi's post on Weatherbell over in the banter thread. I just had a chance to read it and I have to say I have to agree; it is a fascinating read on the big picture of todays climate discussions/debates. Regardless of which side of the fence you side with on this issue its posts like these that need to be read and pondered instead of simply putting on the blinders; focusing on only the discussions on the side that you currently agree with.
Interestingly enough JB also adds discussion about the potential early tropical threat in the same areas that Ray has been discussing. That fact that JB agrees with Ray's ideas is likely another reason Ray likes JB's post so much..lol
All kidding aside the reasoning behind Ray and JB's ideas are sound regarding this potential threat whether it happens or not. So here is the post:
1) https://wattsupwiththat.com/2018/05/17/dont-tell-anyone-but-we-just-had-two-years-of-record-breaking-global-cooling/
We just had a record drop in temperatures, Let me ask you a question as a snow lover. Suppose it was 72 degrees on a January afternoon and in an hour it dropped to 40. Fast 1-hour drop on record, But the normal temps was 32. And it was raining. Would you be bragging about a record drop in temp?
Here is the fact, If it had not gotten so darn warm because of the SUPER NINO, it would not have been as big a drop. If it were for instance 50 and dropped to 20, and it was a record drop and below normal, that's impressive, Though not as big a drop, after the nino of 97-98, and then 04-05,06-07,09-10 TEMPS BY THIS TIME HAD DROPPED BELOW 30 YEAR RUNNING MEANS
But here is the dirty little secret, According to UAH ITS NOT A RECORD. how can I tell? Because the drop from the 97-98 Nino and the peak in early 1998 to the start of 2000 was a) bigger and b) had temps below the 30 year means, You can look at the data
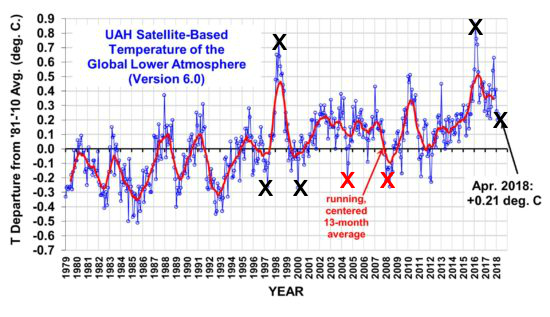
The rise was greater and so was the fall off, In addition this is the ONLY EL NINO where within 2 years temps have not returned to at least the 30 year average one month, The 2 Red x's ( there should be a 3rd in 2012 clearly tell a story in the wake of previous ninos. Here is what I suspect is going on, The super Ninos, and again I think this is natural. stick so much water vapor into the air that they establish a new set point that is higher than the previous one, So unless some super nina comes along, What you may have going on is another 20 year pause, but established at a higher level. I have been throwing this idea around for a couple of years and I will have my answer by the end of 2020 for this modoki coming on, if it does not warm things more, may be followed by an event that would get this back down, So I am not certain But I suspect since the bulk of the warming is where its coldest and driest, then it takes only very tiny amounts of WV to have higher temperatures there and that is reflected in the global temp.
You have to understand that THIS IS VERY RELEVANT TO THE WEATHER, It not just climate, For instance, the GLAAM back in the 1980s was higher on average than it is now. If one goes back and looks at all the GLAAM records, we find that the past 20 years have found lower GLAAM, My take is the temperature and pressure patterns on the planet due to the distorted warming are being affected and that in turn has implications. But you cant simply ignore that stuff if you are going to forecast, no matter what the cause, interestingly enough, it also falls into line with the idea that the weather can be less extreme, but that is not part of the grievance here, But I get emailed things ( the record cooling for instance, or ideas on a little ice age from sudden solar response ) and then I say that is all well and good, but its still warm.
How would you like it if it's snowing back to your west and I am emailing you saying heh, how about that temperature dropping to 40?
Okay now, lets get to some other issues. First of all where life thrives, temperatures are likely not as far above normal as the global temperature, 2cnd using records back to 1895 is a joke, Its warmed no doubt, but using satellite era temperatures that for instance Dr roy Spencer can show) is where we should be. Besides, there has been enough warming the last 35 years to say its warming
Back before the big March 22 storm I went off on the Atmospheric Authoritarians that were all in a huff over people posting eye candy 7-10 days in advance on that storm, Well they are at it again, trying to get people to quit posting the GFS eye candy southeast hurricane, The reason I think there is early season development has to do with the MJO and past similar patterns, But we all know the GFS is going to predict something in advance and until the Euro sees it, the best we can say is the GFS is trying to sniff out the pattern, But it tells you something about the weakness in the model when it comes to how it handles heat and feedback and that has got to affect the US suite of models if the same basic ideas are used in the model, but no matter, when i got slammed for jumping all over Sandy so far out ( hence my sensitivity to the matter) look what happened, I pointed out a case 2 winters ago when the authority was slamming ideas a week out on a big southern snow/ice event and look what happened, Anyone notice that was one heck of a storm March 20-22? And what about the April snow in the lakes Well if the past is a predictor of the future, the authoritarians are showing up again, I can't figure it out, They must be threatened that weather hobbyists or whatever are doing their job? What else can it be? Listen you want to post maps go for it. If you are wrong enough, people won't care. If you are right enough they will, But this idea that somehow people are too stupid to be able to figure out if they can post something, and people are too stupid to figure out if something was right or wrong and use that flies in the face of freedom of choice in my opinion, This isnt yelling fire in a crowded theatre, its people that are into the weather so much they cant sleep so they are posting maps, So what more power to them, So you have to worry about what you say, and in the weather about what you post if you are a weather hobbyist? What makes anyone think they KNOW tomorrow, if someone wants to have an opinion and post, go for it,
You know maybe there is another motive. It could be that if you actually post every GFS hurricane, people will realize how bad modeling is, As I have tried to make clear about this early season development idea, its the MJO that has me watching this, What next no posting MJO forecasts?
Sea Ice is important, Snowfall is important, I dont pay much attention to either because it is an endless loop of tit for tat, back and forth, Let me give you an example
Currently seas ice in the Antarctic is well below average so this is an aha moment . It might even be a record for the date
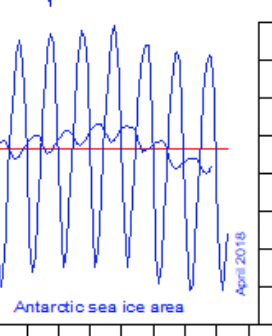
but 3 years ago it was at record highs. That was covered up except for the nerds that follow this. the other side was in denial,
2 years ago Greenland had reportedly record low snow and ice cover, Not anymore
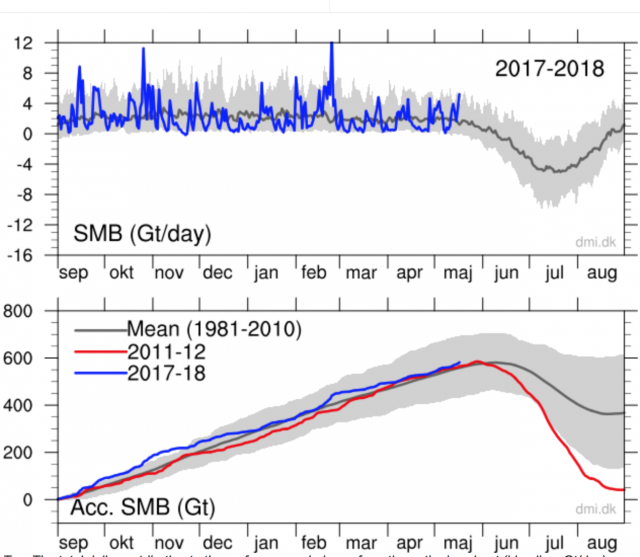
anyone making a big deal about that,
Arctic sea ice is near record lows for the date ( which means with antarctic, for the date, we are probably at record lows)

but here is the problem, Just like Greenland had alot of snow and ice to reverse, antartica may quickly go back to or above normal anytime. Combine that with the CFSV2 sea ice forecast ( which is clearly overdone, but says to me the record low min that occurred after el ninos of 06 and 09-10 is likely not going to occur
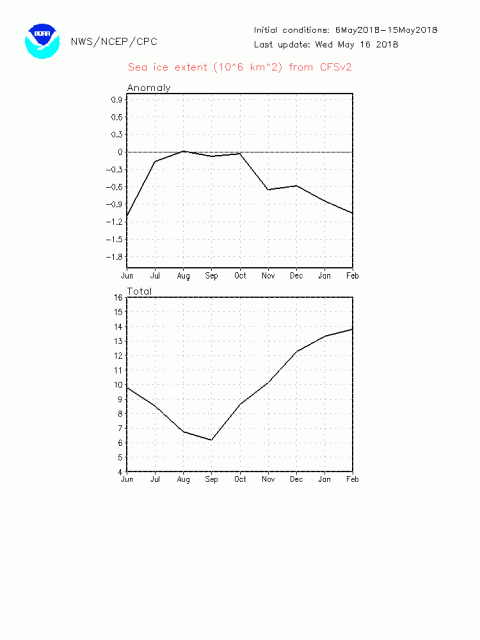
means that by the end of our summer, those totals that are low now may be quite a bit closer to normal, The CFSV2 back in 2012 , showed a collapse of the arctic sea ice anomaly
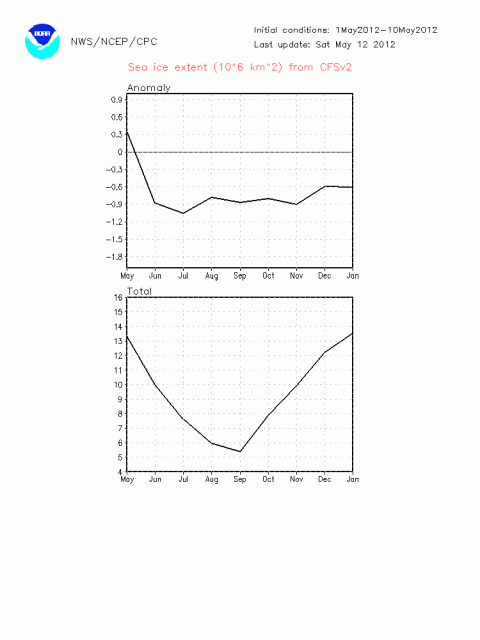
so it saw it decreasing, something it has not done the past few years ( though its always overdone) but chances are this post nino will be different than the previous ones mentioned because there is no record summer min, The dirty little secret is the frigid arctic winters are a bit warmer, but no one will tell you the summers are not,
How about snowcover.
Summer snowcover is decreasing
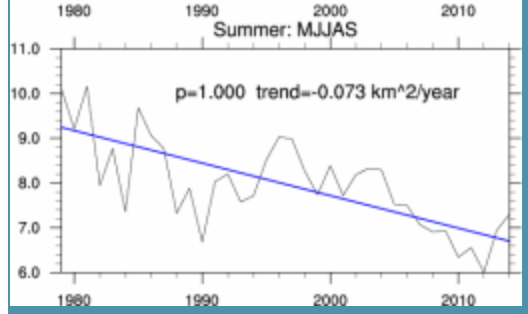
but winter is going the opposite way, and that is impressive
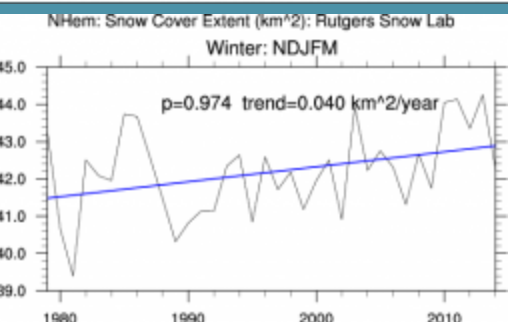
because when you have something that is at a high point, its tougher to get it even higher, What no one really shows is THE AREAL COVERAGE BY YEAR OF SNOW AND ICE TOGETHER AT ITS MAX. People point out less ice in the Arctic , but I suspect the amount of snow and ice together is about the same, as less ice but more snow may balance things out. Again Water vapor is the key, For it limits how cold it can get if there are more clouds in these areas, but it snows more as a counterweight,
Finally where its warmer is a big deal, Look at this JMA 30 day between 60 north and south where most of the life on the planet lives
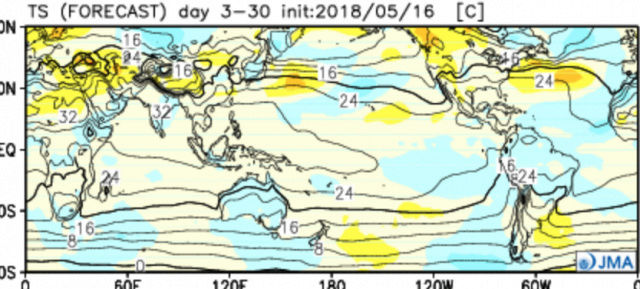
Blue and yellow look about equal
So I have aired some grievances here Friday, I caution people looking for a colder climate than the record drop if we put it in perspective is not that big a deal and truth be told, it does not even look to be one, since a bigger drop occurred in a smaller period of time ( after a record rise)
I have my reasons for an early season storm, but given some examples when I have spoken up against the Weather Authoritarians that wish to silence the blogging community posting of wild maps, and the fact that those features then showed up perhaps that's even a stronger reason haha You just keep on posting and giving your opinion. Free will is an inalienable right: a right according to natural law, a right that cannot be taken away, denied, or transferred
Always be skeptical, first of your own ideas ( you can use criticisms to help) but in anything that is important to you. Just my opinion, yours may be different and thats fine with me,
Notes and asides
Day 2 of a bird slamming himself into my sliding door window downstairs trying to get into the house, Very strange, Must be too much co2
Interestingly enough JB also adds discussion about the potential early tropical threat in the same areas that Ray has been discussing. That fact that JB agrees with Ray's ideas is likely another reason Ray likes JB's post so much..lol

All kidding aside the reasoning behind Ray and JB's ideas are sound regarding this potential threat whether it happens or not. So here is the post:
1) https://wattsupwiththat.com/2018/05/17/dont-tell-anyone-but-we-just-had-two-years-of-record-breaking-global-cooling/
We just had a record drop in temperatures, Let me ask you a question as a snow lover. Suppose it was 72 degrees on a January afternoon and in an hour it dropped to 40. Fast 1-hour drop on record, But the normal temps was 32. And it was raining. Would you be bragging about a record drop in temp?
Here is the fact, If it had not gotten so darn warm because of the SUPER NINO, it would not have been as big a drop. If it were for instance 50 and dropped to 20, and it was a record drop and below normal, that's impressive, Though not as big a drop, after the nino of 97-98, and then 04-05,06-07,09-10 TEMPS BY THIS TIME HAD DROPPED BELOW 30 YEAR RUNNING MEANS
But here is the dirty little secret, According to UAH ITS NOT A RECORD. how can I tell? Because the drop from the 97-98 Nino and the peak in early 1998 to the start of 2000 was a) bigger and b) had temps below the 30 year means, You can look at the data

The rise was greater and so was the fall off, In addition this is the ONLY EL NINO where within 2 years temps have not returned to at least the 30 year average one month, The 2 Red x's ( there should be a 3rd in 2012 clearly tell a story in the wake of previous ninos. Here is what I suspect is going on, The super Ninos, and again I think this is natural. stick so much water vapor into the air that they establish a new set point that is higher than the previous one, So unless some super nina comes along, What you may have going on is another 20 year pause, but established at a higher level. I have been throwing this idea around for a couple of years and I will have my answer by the end of 2020 for this modoki coming on, if it does not warm things more, may be followed by an event that would get this back down, So I am not certain But I suspect since the bulk of the warming is where its coldest and driest, then it takes only very tiny amounts of WV to have higher temperatures there and that is reflected in the global temp.
You have to understand that THIS IS VERY RELEVANT TO THE WEATHER, It not just climate, For instance, the GLAAM back in the 1980s was higher on average than it is now. If one goes back and looks at all the GLAAM records, we find that the past 20 years have found lower GLAAM, My take is the temperature and pressure patterns on the planet due to the distorted warming are being affected and that in turn has implications. But you cant simply ignore that stuff if you are going to forecast, no matter what the cause, interestingly enough, it also falls into line with the idea that the weather can be less extreme, but that is not part of the grievance here, But I get emailed things ( the record cooling for instance, or ideas on a little ice age from sudden solar response ) and then I say that is all well and good, but its still warm.
How would you like it if it's snowing back to your west and I am emailing you saying heh, how about that temperature dropping to 40?
Okay now, lets get to some other issues. First of all where life thrives, temperatures are likely not as far above normal as the global temperature, 2cnd using records back to 1895 is a joke, Its warmed no doubt, but using satellite era temperatures that for instance Dr roy Spencer can show) is where we should be. Besides, there has been enough warming the last 35 years to say its warming
Back before the big March 22 storm I went off on the Atmospheric Authoritarians that were all in a huff over people posting eye candy 7-10 days in advance on that storm, Well they are at it again, trying to get people to quit posting the GFS eye candy southeast hurricane, The reason I think there is early season development has to do with the MJO and past similar patterns, But we all know the GFS is going to predict something in advance and until the Euro sees it, the best we can say is the GFS is trying to sniff out the pattern, But it tells you something about the weakness in the model when it comes to how it handles heat and feedback and that has got to affect the US suite of models if the same basic ideas are used in the model, but no matter, when i got slammed for jumping all over Sandy so far out ( hence my sensitivity to the matter) look what happened, I pointed out a case 2 winters ago when the authority was slamming ideas a week out on a big southern snow/ice event and look what happened, Anyone notice that was one heck of a storm March 20-22? And what about the April snow in the lakes Well if the past is a predictor of the future, the authoritarians are showing up again, I can't figure it out, They must be threatened that weather hobbyists or whatever are doing their job? What else can it be? Listen you want to post maps go for it. If you are wrong enough, people won't care. If you are right enough they will, But this idea that somehow people are too stupid to be able to figure out if they can post something, and people are too stupid to figure out if something was right or wrong and use that flies in the face of freedom of choice in my opinion, This isnt yelling fire in a crowded theatre, its people that are into the weather so much they cant sleep so they are posting maps, So what more power to them, So you have to worry about what you say, and in the weather about what you post if you are a weather hobbyist? What makes anyone think they KNOW tomorrow, if someone wants to have an opinion and post, go for it,
You know maybe there is another motive. It could be that if you actually post every GFS hurricane, people will realize how bad modeling is, As I have tried to make clear about this early season development idea, its the MJO that has me watching this, What next no posting MJO forecasts?
Sea Ice is important, Snowfall is important, I dont pay much attention to either because it is an endless loop of tit for tat, back and forth, Let me give you an example
Currently seas ice in the Antarctic is well below average so this is an aha moment . It might even be a record for the date

but 3 years ago it was at record highs. That was covered up except for the nerds that follow this. the other side was in denial,
2 years ago Greenland had reportedly record low snow and ice cover, Not anymore

anyone making a big deal about that,
Arctic sea ice is near record lows for the date ( which means with antarctic, for the date, we are probably at record lows)

but here is the problem, Just like Greenland had alot of snow and ice to reverse, antartica may quickly go back to or above normal anytime. Combine that with the CFSV2 sea ice forecast ( which is clearly overdone, but says to me the record low min that occurred after el ninos of 06 and 09-10 is likely not going to occur

means that by the end of our summer, those totals that are low now may be quite a bit closer to normal, The CFSV2 back in 2012 , showed a collapse of the arctic sea ice anomaly

so it saw it decreasing, something it has not done the past few years ( though its always overdone) but chances are this post nino will be different than the previous ones mentioned because there is no record summer min, The dirty little secret is the frigid arctic winters are a bit warmer, but no one will tell you the summers are not,
How about snowcover.
Summer snowcover is decreasing

but winter is going the opposite way, and that is impressive

because when you have something that is at a high point, its tougher to get it even higher, What no one really shows is THE AREAL COVERAGE BY YEAR OF SNOW AND ICE TOGETHER AT ITS MAX. People point out less ice in the Arctic , but I suspect the amount of snow and ice together is about the same, as less ice but more snow may balance things out. Again Water vapor is the key, For it limits how cold it can get if there are more clouds in these areas, but it snows more as a counterweight,
Finally where its warmer is a big deal, Look at this JMA 30 day between 60 north and south where most of the life on the planet lives

Blue and yellow look about equal
So I have aired some grievances here Friday, I caution people looking for a colder climate than the record drop if we put it in perspective is not that big a deal and truth be told, it does not even look to be one, since a bigger drop occurred in a smaller period of time ( after a record rise)
I have my reasons for an early season storm, but given some examples when I have spoken up against the Weather Authoritarians that wish to silence the blogging community posting of wild maps, and the fact that those features then showed up perhaps that's even a stronger reason haha You just keep on posting and giving your opinion. Free will is an inalienable right: a right according to natural law, a right that cannot be taken away, denied, or transferred
Always be skeptical, first of your own ideas ( you can use criticisms to help) but in anything that is important to you. Just my opinion, yours may be different and thats fine with me,
Notes and asides
Day 2 of a bird slamming himself into my sliding door window downstairs trying to get into the house, Very strange, Must be too much co2
_________________
"In weather and in life, there's no winning and losing; there's only winning and learning."
WINTER 2012/2013 TOTALS 43.65"WINTER 2017/2018 TOTALS 62.85" WINTER 2022/2023 TOTALS 4.9"
WINTER 2013/2014 TOTALS 64.85"WINTER 2018/2019 TOTALS 14.25" WINTER 2023/2024 TOTALS 13.1"
WINTER 2014/2015 TOTALS 71.20"WINTER 2019/2020 TOTALS 6.35"
WINTER 2015/2016 TOTALS 35.00"WINTER 2020/2021 TOTALS 37.75"
WINTER 2016/2017 TOTALS 42.25"WINTER 2021/2022 TOTALS 31.65"

sroc4- Admin

- Posts : 8354
Reputation : 302
Join date : 2013-01-07
Location : Wading River, LI
 Re: May 2018 Observations & Discussions
sroc4 wrote:So Ray, aka rb, posted about J. Bastardi's post on Weatherbell over in the banter thread. I just had a chance to read it and I have to say I have to agree; it is a fascinating read on the big picture of todays climate discussions/debates. Regardless of which side of the fence you side with on this issue its posts like these that need to be read and pondered instead of simply putting on the blinders; focusing on only the discussions on the side that you currently agree with.
Interestingly enough JB also adds discussion about the potential early tropical threat in the same areas that Ray has been discussing. That fact that JB agrees with Ray's ideas is likely another reason Ray likes JB's post so much..lol
All kidding aside the reasoning behind Ray and JB's ideas are sound regarding this potential threat whether it happens or not. So here is the post:
1) https://wattsupwiththat.com/2018/05/17/dont-tell-anyone-but-we-just-had-two-years-of-record-breaking-global-cooling/
We just had a record drop in temperatures, Let me ask you a question as a snow lover. Suppose it was 72 degrees on a January afternoon and in an hour it dropped to 40. Fast 1-hour drop on record, But the normal temps was 32. And it was raining. Would you be bragging about a record drop in temp?
Here is the fact, If it had not gotten so darn warm because of the SUPER NINO, it would not have been as big a drop. If it were for instance 50 and dropped to 20, and it was a record drop and below normal, that's impressive, Though not as big a drop, after the nino of 97-98, and then 04-05,06-07,09-10 TEMPS BY THIS TIME HAD DROPPED BELOW 30 YEAR RUNNING MEANS
But here is the dirty little secret, According to UAH ITS NOT A RECORD. how can I tell? Because the drop from the 97-98 Nino and the peak in early 1998 to the start of 2000 was a) bigger and b) had temps below the 30 year means, You can look at the data
The rise was greater and so was the fall off, In addition this is the ONLY EL NINO where within 2 years temps have not returned to at least the 30 year average one month, The 2 Red x's ( there should be a 3rd in 2012 clearly tell a story in the wake of previous ninos. Here is what I suspect is going on, The super Ninos, and again I think this is natural. stick so much water vapor into the air that they establish a new set point that is higher than the previous one, So unless some super nina comes along, What you may have going on is another 20 year pause, but established at a higher level. I have been throwing this idea around for a couple of years and I will have my answer by the end of 2020 for this modoki coming on, if it does not warm things more, may be followed by an event that would get this back down, So I am not certain But I suspect since the bulk of the warming is where its coldest and driest, then it takes only very tiny amounts of WV to have higher temperatures there and that is reflected in the global temp.
You have to understand that THIS IS VERY RELEVANT TO THE WEATHER, It not just climate, For instance, the GLAAM back in the 1980s was higher on average than it is now. If one goes back and looks at all the GLAAM records, we find that the past 20 years have found lower GLAAM, My take is the temperature and pressure patterns on the planet due to the distorted warming are being affected and that in turn has implications. But you cant simply ignore that stuff if you are going to forecast, no matter what the cause, interestingly enough, it also falls into line with the idea that the weather can be less extreme, but that is not part of the grievance here, But I get emailed things ( the record cooling for instance, or ideas on a little ice age from sudden solar response ) and then I say that is all well and good, but its still warm.
How would you like it if it's snowing back to your west and I am emailing you saying heh, how about that temperature dropping to 40?
Okay now, lets get to some other issues. First of all where life thrives, temperatures are likely not as far above normal as the global temperature, 2cnd using records back to 1895 is a joke, Its warmed no doubt, but using satellite era temperatures that for instance Dr roy Spencer can show) is where we should be. Besides, there has been enough warming the last 35 years to say its warming
Back before the big March 22 storm I went off on the Atmospheric Authoritarians that were all in a huff over people posting eye candy 7-10 days in advance on that storm, Well they are at it again, trying to get people to quit posting the GFS eye candy southeast hurricane, The reason I think there is early season development has to do with the MJO and past similar patterns, But we all know the GFS is going to predict something in advance and until the Euro sees it, the best we can say is the GFS is trying to sniff out the pattern, But it tells you something about the weakness in the model when it comes to how it handles heat and feedback and that has got to affect the US suite of models if the same basic ideas are used in the model, but no matter, when i got slammed for jumping all over Sandy so far out ( hence my sensitivity to the matter) look what happened, I pointed out a case 2 winters ago when the authority was slamming ideas a week out on a big southern snow/ice event and look what happened, Anyone notice that was one heck of a storm March 20-22? And what about the April snow in the lakes Well if the past is a predictor of the future, the authoritarians are showing up again, I can't figure it out, They must be threatened that weather hobbyists or whatever are doing their job? What else can it be? Listen you want to post maps go for it. If you are wrong enough, people won't care. If you are right enough they will, But this idea that somehow people are too stupid to be able to figure out if they can post something, and people are too stupid to figure out if something was right or wrong and use that flies in the face of freedom of choice in my opinion, This isnt yelling fire in a crowded theatre, its people that are into the weather so much they cant sleep so they are posting maps, So what more power to them, So you have to worry about what you say, and in the weather about what you post if you are a weather hobbyist? What makes anyone think they KNOW tomorrow, if someone wants to have an opinion and post, go for it,
You know maybe there is another motive. It could be that if you actually post every GFS hurricane, people will realize how bad modeling is, As I have tried to make clear about this early season development idea, its the MJO that has me watching this, What next no posting MJO forecasts?
Sea Ice is important, Snowfall is important, I dont pay much attention to either because it is an endless loop of tit for tat, back and forth, Let me give you an example
Currently seas ice in the Antarctic is well below average so this is an aha moment . It might even be a record for the date
but 3 years ago it was at record highs. That was covered up except for the nerds that follow this. the other side was in denial,
2 years ago Greenland had reportedly record low snow and ice cover, Not anymore
anyone making a big deal about that,
Arctic sea ice is near record lows for the date ( which means with antarctic, for the date, we are probably at record lows)
but here is the problem, Just like Greenland had alot of snow and ice to reverse, antartica may quickly go back to or above normal anytime. Combine that with the CFSV2 sea ice forecast ( which is clearly overdone, but says to me the record low min that occurred after el ninos of 06 and 09-10 is likely not going to occur
means that by the end of our summer, those totals that are low now may be quite a bit closer to normal, The CFSV2 back in 2012 , showed a collapse of the arctic sea ice anomaly
so it saw it decreasing, something it has not done the past few years ( though its always overdone) but chances are this post nino will be different than the previous ones mentioned because there is no record summer min, The dirty little secret is the frigid arctic winters are a bit warmer, but no one will tell you the summers are not,
How about snowcover.
Summer snowcover is decreasing
but winter is going the opposite way, and that is impressive
because when you have something that is at a high point, its tougher to get it even higher, What no one really shows is THE AREAL COVERAGE BY YEAR OF SNOW AND ICE TOGETHER AT ITS MAX. People point out less ice in the Arctic , but I suspect the amount of snow and ice together is about the same, as less ice but more snow may balance things out. Again Water vapor is the key, For it limits how cold it can get if there are more clouds in these areas, but it snows more as a counterweight,
Finally where its warmer is a big deal, Look at this JMA 30 day between 60 north and south where most of the life on the planet lives
Blue and yellow look about equal
So I have aired some grievances here Friday, I caution people looking for a colder climate than the record drop if we put it in perspective is not that big a deal and truth be told, it does not even look to be one, since a bigger drop occurred in a smaller period of time ( after a record rise)
I have my reasons for an early season storm, but given some examples when I have spoken up against the Weather Authoritarians that wish to silence the blogging community posting of wild maps, and the fact that those features then showed up perhaps that's even a stronger reason haha You just keep on posting and giving your opinion. Free will is an inalienable right: a right according to natural law, a right that cannot be taken away, denied, or transferred
Always be skeptical, first of your own ideas ( you can use criticisms to help) but in anything that is important to you. Just my opinion, yours may be different and thats fine with me,
Notes and asides
Day 2 of a bird slamming himself into my sliding door window downstairs trying to get into the house, Very strange, Must be too much co2
Wow Scott, this looks really interesting, but I will wait to read this tonight when the house is quiet!
_________________
Janet
Snowfall winter of 2023-2024 17.5"
Snowfall winter of 2022-2023 6.0"
Snowfall winter of 2021-2022 17.6" 1" sleet 2/25/22
Snowfall winter of 2020-2021 51.1"
Snowfall winter of 2019-2020 8.5"
Snowfall winter of 2018-2019 25.1"
Snowfall winter of 2017-2018 51.9"
Snowfall winter of 2016-2017 45.6"
Snowfall winter of 2015-2016 29.5"
Snowfall winter of 2014-2015 50.55"
Snowfall winter of 2013-2014 66.5"
Dunnzoo- Senior Enthusiast - Mod

- Posts : 4904
Reputation : 68
Join date : 2013-01-11
Age : 62
Location : Westwood, NJ
 Re: May 2018 Observations & Discussions
Thanks for posting, Scott!!! As for the reason why I enjoyed it so much, that would be one forecast you busted on this year lmfaooo nah, the reason I enjoyed it was mainly because of how he openly supports what we do in/on forums and underground sites like this, others, and personal pages where forecasts are presented to the public. He has a great point, and takes a very similar stance as I do when I comes to interpreting the response from "professional" organizations. They claim that people like us hype everything by showing maps at 300 hours out and getting excited. A) if you're truly into meteorology, and you see a Blizzard of 1888 or Sandy redux, I don't care who you are you're gonna bring it up. It's fun to look at and discuss, that's all. Now, there are those who DO hype events, and it does tarnish our reputation a little, but B) I have enough faith in the public to at least understand the difference between hype, where images are posted with no reasoning, and educated discussion/precaution, where reasons are given as to why it's possible and important to pay attention to. Lastly, is it hype if it happens? Going back to our collective accuracy, how many times do we ACTUALLY end up hyping something to the point where it busts entirely? Not many. Sure, it may not be bad in your backyard, but I think the underground community does a pretty good job of presenting sound reasoning for events to support our excitement for them, which then end up verifying pretty well, at the very least.
As I have stated countless times, I have interacted with the best forecasters on this forum and elsewhere, that I have ever had the pleasure of following/knowing. Hands down. How many times are we (collectively) laps ahead of them in not only picking up on threats/events, but also with respect to the accuracy of our forecasts? It's not even comparable. I think he's spot on when he brings up the fact that they're scared of being shown up in the public eye, as well as being brought to the table to discuss why some of our modeling is so inferior compared to others, and then called on to fix it after spending billions of dollars on it over the last several years alone. It's easier to dismiss us entirely and go on their merry way because we "are not professionals" than to own up to the fact that regularly get beat. I'm not saying that what they do isn't important; their warnings save lives, there's no question. But I can't even imagine how good U.S. forecasts/forecasters could be if the lines of "professionalism" were blurred. I'm technically a "professional", and I am the first to admit I would not even be in the same league with my forecasting as I am if I hadn't found this forum and subsequently branched out to a couple others in recent months. I have learned, and continue to learn, more about forecasting here than I did in my entire time at school, and I imagine there would be similar results if people like you/us were allowed to take part and add value to "professional" organizations.
He also brings up a great point about accuracy: If you're wrong a lot, people won't follow you. If you are, then that's how you grow a following. It's simple. Lastly, this argument can be brought full-circle to research in the field. Why is it ONLY academia and government studies get funded for research? Why can't people active in the private sector getting their hands dirty every day add value? Hell, I think WeatherBell's Pioneer model could add a heck of a lot of value to the CPC outlooks. Or, how about other ideas being worked on behind closed doors in various companies, like my project? Science is science, and it should be open to pursue, debate, and disclose, not dedicated to a few sectors. Sorry about the rant, but THAT'S why I like his post so much. I will admit, though, it's nice to have support for my "horse" in this "race" lmao
rb924119- Meteorologist

- Posts : 6928
Reputation : 194
Join date : 2013-02-06
Age : 32
Location : Greentown, Pa
 Re: May 2018 Observations & Discussions
The image on the left is the 12Z 3km NAM valid 3 PM today, with no rain in Delaware
The image on the right is the actual radar valid 2:58 PM today with plenty of rain in Delaware

A god awful job by the 12Z 3km NAM today.
The image on the right is the actual radar valid 2:58 PM today with plenty of rain in Delaware

A god awful job by the 12Z 3km NAM today.
Math23x7- Wx Statistician Guru

- Posts : 2379
Reputation : 68
Join date : 2013-01-08
 Re: May 2018 Observations & Discussions
MJO phase 2 = Tropical Cyclonic Activity in Western Carribean. Great call Rb and Sroc on this
Also Memorial Day may be looking unettled. The GFS is showing the Tropical LP coming up the eastern seaboard. Timing is still variation but nonetheless it keeps showing this.
I have a paper that is 110 pages long that is a very interesting read for its work on solar and it's effects on weather, patterns, food production and human population.
_________________
Mugs
AKA:King: Snow Weenie
Self Proclaimed
WINTER 2014-15 : 55.12" +.02 for 6 coatings (avg. 35")
WINTER 2015-16 Total - 29.8" (Avg 35")
WINTER 2016-17 : 39.5" so far

amugs- Advanced Forecaster - Mod

- Posts : 15095
Reputation : 213
Join date : 2013-01-07
Age : 54
Location : Hillsdale,NJ
 Re: May 2018 Observations & Discussions
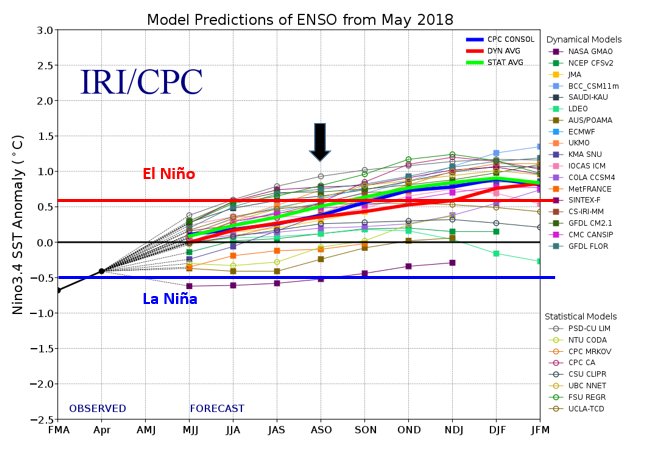
Nino incoming for next winter. Sub surface waters support this to. As Sroc stated in a tremendous write up above Modoki El Nino

_________________
Mugs
AKA:King: Snow Weenie
Self Proclaimed
WINTER 2014-15 : 55.12" +.02 for 6 coatings (avg. 35")
WINTER 2015-16 Total - 29.8" (Avg 35")
WINTER 2016-17 : 39.5" so far

amugs- Advanced Forecaster - Mod

- Posts : 15095
Reputation : 213
Join date : 2013-01-07
Age : 54
Location : Hillsdale,NJ
Page 5 of 7 •  1, 2, 3, 4, 5, 6, 7
Permissions in this forum:
You cannot reply to topics in this forum|
|
|

 Home
Home