Long Range Thread 17.0
+40
Radz
lglickman1
Wheezer
aiannone
heehaw453
SENJsnowman
Scullybutcher
jake732
Sanchize06
larryrock72
bobjohnsonforthehall
SnowForest
hyde345
SoulSingMG
weatherwatchermom
MattyICE
GreyBeard
Smittyaj623
HectorO
Vinnydula
Nyi1058
jmanley32
CPcantmeasuresnow
Dunnzoo
algae888
skinsfan1177
Snow88
Quietace
rb924119
dkodgis
sroc4
docstox12
Grselig
amugs
Math23x7
billg315
nutleyblizzard
frank 638
mwilli5783
Frank_Wx
44 posters
Page 2 of 41
Page 2 of 41 •  1, 2, 3 ... 21 ... 41
 Re: Long Range Thread 17.0
Frank_Wx wrote:frank 638 wrote:Frank do you think Oct will turn out to be like last year or will it be below normal for temps wise
My definition of "normal" is -0.5 to +0.5
Below normal is less than -0.5
Above normal is greater than +0.5
I think October will finish above normal. Even though it looks to start out cool the days we get warm could be very warm. Not sure if the air will be cold enough to off-set those warm days just yet.
This can change though. If the MJO does get active and the Stratosphere continues to warm...early high latitude blocking may develop which would ensure a below normal October. I'm not seeing that quite yet, however.
ANd why can it get warm? look at the SST off the coast - very much AN and this will help propagate warmth when the EPO, AO, PNA drivers aren't there in one respect - it allows the WAR to flex its muscle and expand west.
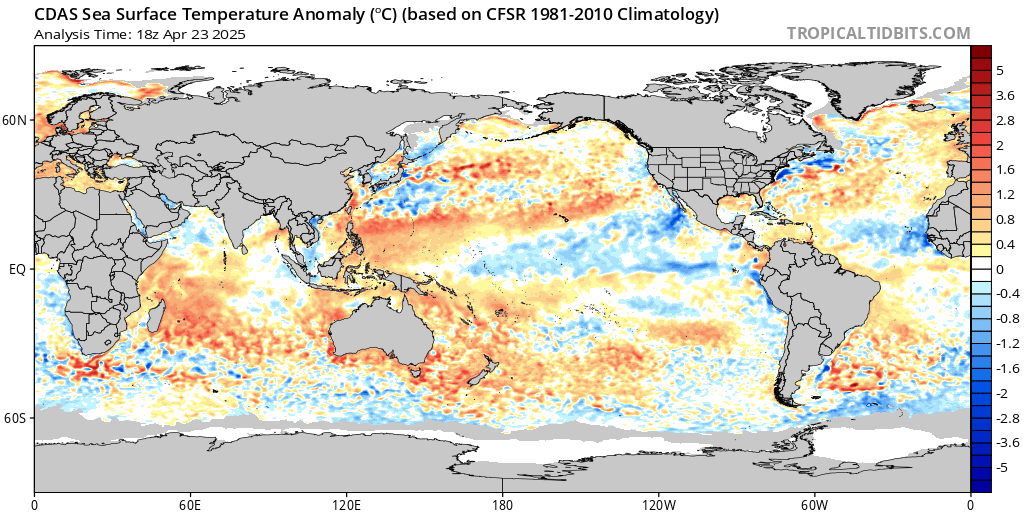
BUT I love that AN pool of water in the Gulf of ALaska and the Aleutians - that may do wonders for a N WPO and EPO couplet as well as help the PNA feedback - can we get that over the top of the arctic? Remains to be seen but tropical forcing (ENSO - Weak Nino) AAM and GWO along with the QBO and low solar are also mechanisms we need to be aware of.
amugs- Advanced Forecaster - Mod

- Posts : 15095
Join date : 2013-01-07
 Re: Long Range Thread 17.0
I think I lost my post from before so here goes again. My limited understanding is the Modoki El Nino is a more centered, warmer section of the Pacific and we may get a snowier and colder winter-at least I think this was the setup in those two winters 2013,2014 that Bastardi said would be very cold. Also, if there is high pressure off of Alaska, this encourages the Jetstream to dip and in comes the arctic air. I remember asking Frank about why Red Sox Suck had so much snow that one year and he said there was blocking above Greenland-which I think may be in place this winter. Add Mugs' comments on the solar minimum and get ya popcorn. Al this may thaw CP before long.
dkodgis- Senior Enthusiast

- Posts : 2560
Join date : 2013-12-29
 Re: Long Range Thread 17.0
Frank_Wx wrote:Piggy-backing off my posts above the models continue to show what would be a blast of fall-like temps into the area late September into early October. The -EPO/+PNA forces a trough over the east.
GEFS September 29th:
The EPS are in agreement
It will be interesting to see how long the trough will hold over the east. I think the period between September 28th (+/- 2 days) and October 4th (+/- 2 days) will feature below normal temps. How long it lasts remains to be seen. Most likely, this time of year, it is transient.
Here is the EPS and GEFS for the Sept 29th time frame(same map Frank posted from a few days ago). As you can see the 500mb evolution is to temper the troughing expectations into the EC as we get in closer with the warmth still pushing back. As you can see the -EPO is a key player in driving some exceptionally cold air into central Canada, but the PNA region is neg; not positive, and the WAR is fighting back. Result is a trough that swings through the region cooling us off but the warmth returns behind it.

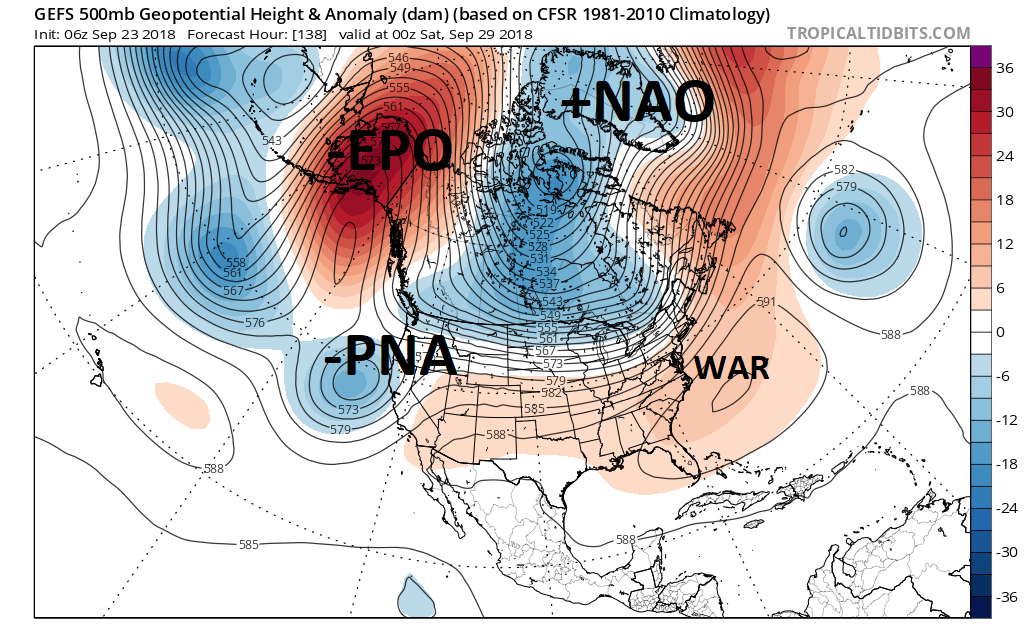
I would have to agree with Frank here in saying that these cool shots and troughing into the Easten third of the country are coming; however, IMO for now they will most likely be transient, but could be frequent. On the heals of the cool shots, like Mugsy posted above regarding the SSTA off the EC, the western Atlantic ridge (WAR) will still flex; therefore, I do believe the warmth will likely balance out the cool such that when we look at the temp anomalies over the next 2-4week stretch in hindsight they will likely be around N to maybe slight above normal.
In the tropical thread I had mentioned that there was an MJO pulse coming out into phases 8-1 with some decent amplitude. As you can see below that is still the case.
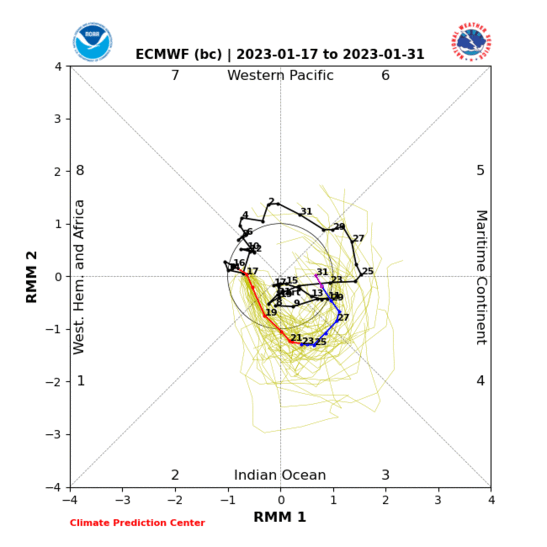

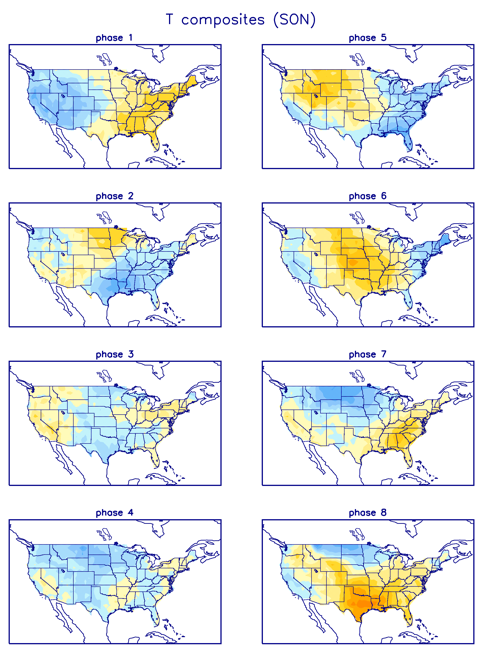
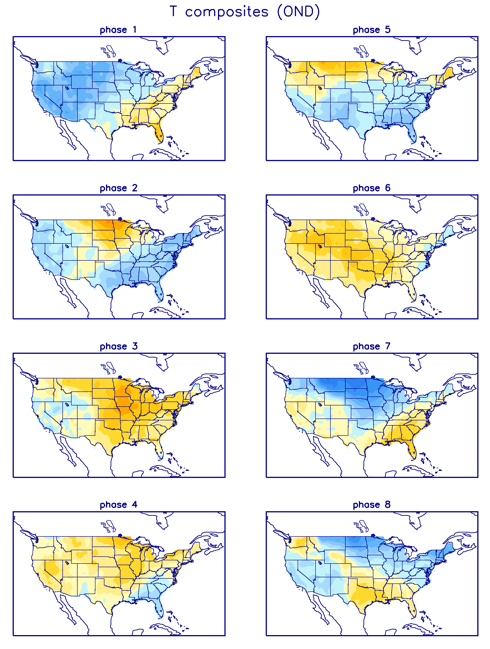
Some of you might hear phase 8-1 and think heck these are usually great phases for cold into the east. In November though March you would be correct; however, at different times of year the phases of the MJO behave differently due to seasonal variations. Below are the temperature composites for the MJO phases that correlate with different times of the year. There are 4 images below. . First is August/Sept/Oct (ASO), then SON, then OND, and finally NDJ. Follow the evolution for phases 8-1. Notice 8-1 are actually warm phases of the MJO in the east until the OND composite when you see the transition to cool for 8 warm for 1. As you head into the heart of winter 8-1 become cool phases throughout. Obv we are still in Sept but close to Oct. So if you avg out the ASO, SON composite we still see that in general we should see overall AN temp anomalies in our neck of the woods when the MJO is in phases 8-1, esp when there is amplitude like the forecast suggests.


Ill leave you with one last image. Below is the current global SST anomalies. In general where you see the large areas of warmer anomalies is where you would expect lower pressures due to rising warmer air. The current configuration suggests that if this were to hold into the winter any MJO pulses would likely feedback on themselves in the more favorable phases for cold and snow for the East.
This is in stark contrast to last year. For me pay particular attention north of Australia surrounding the Phillipenes. This area is associated with phases 3-6 (warm phases in winter). This was a fear of mine last year and we did in fact develop such a feedback loop that resulted in several exceptionally strong pulses through these warm phases and a long stretch of very warm temp anomalies in our neck of the woods from mid Jan through most of Feb. Here was your SSTA configuration last winter and the MJO(notice the strength through all of Jan:
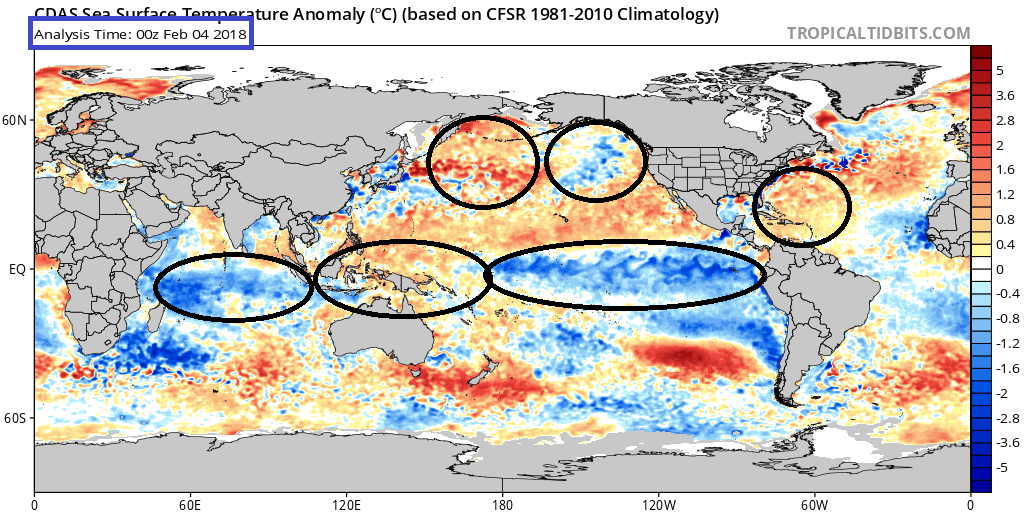
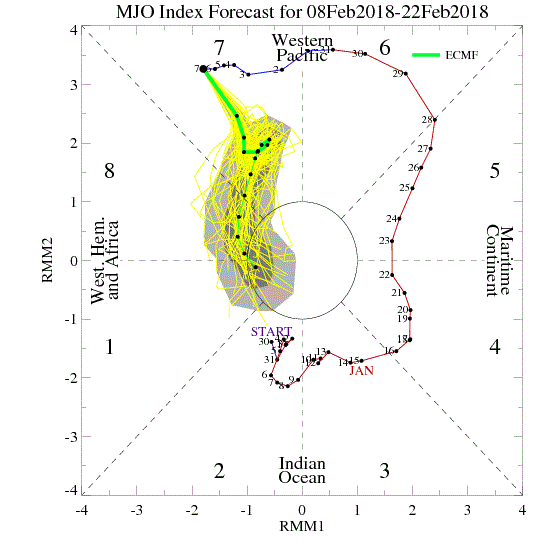
As we sit right now, IF the ENSO region conts to evolve as expected, either weak Modoki el Nino or warm Neutral, and the Indian ocean SSTA configuration doesn't do anything drastically different and the N Atlantic does not drastically alter its SSTA, then IMHO we are in really great (not good) position for the winter season.
Last edited by sroc4 on Mon Sep 24, 2018 8:36 am; edited 3 times in total
_________________
"In weather and in life, there's no winning and losing; there's only winning and learning."
WINTER 2012/2013 TOTALS 43.65"WINTER 2017/2018 TOTALS 62.85" WINTER 2022/2023 TOTALS 4.9"
WINTER 2013/2014 TOTALS 64.85"WINTER 2018/2019 TOTALS 14.25" WINTER 2023/2024 TOTALS 13.1"
WINTER 2014/2015 TOTALS 71.20"WINTER 2019/2020 TOTALS 6.35"
WINTER 2015/2016 TOTALS 35.00"WINTER 2020/2021 TOTALS 37.75"
WINTER 2016/2017 TOTALS 42.25"WINTER 2021/2022 TOTALS 31.65"

sroc4- Admin

- Posts : 8354
Reputation : 302
Join date : 2013-01-07
Location : Wading River, LI
 Re: Long Range Thread 17.0
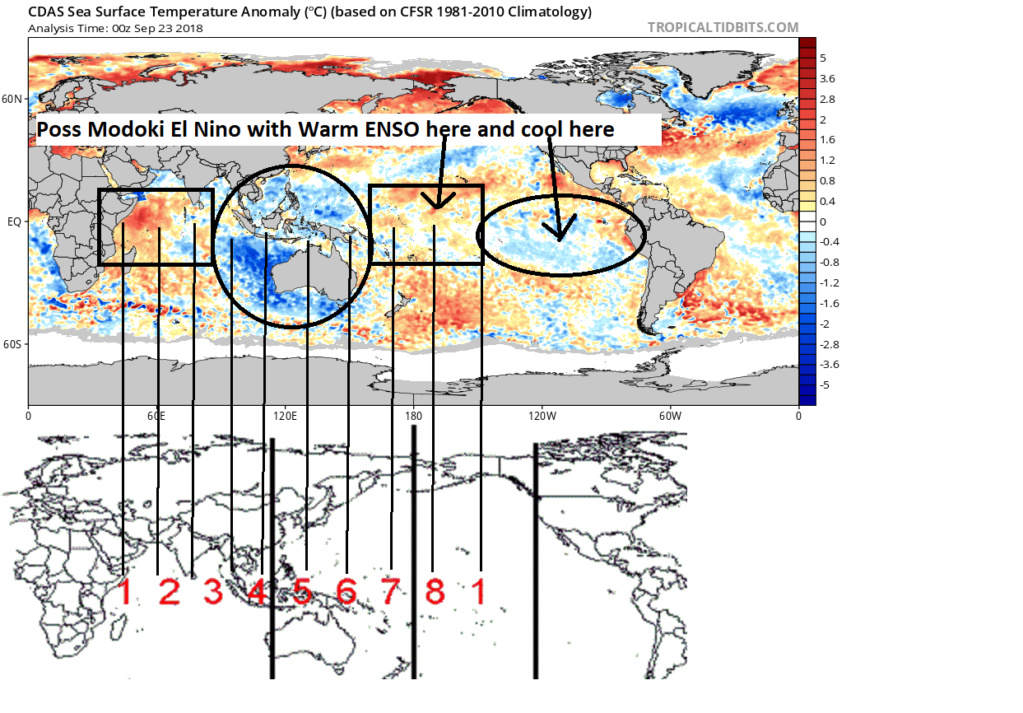
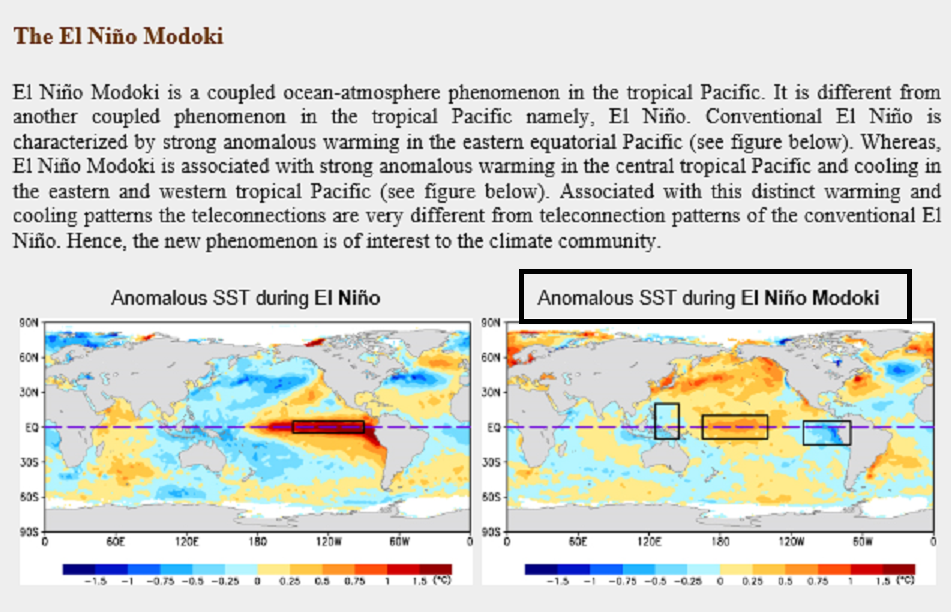
Between the circle and oval there is a rectangle-in the last image you left us with and not the images from last year-and I see the blue above that rectangle. Is that the Modoki showing up? I hear Modoki and I associate the word “centered”.

dkodgis- Senior Enthusiast

- Posts : 2560
Reputation : 98
Join date : 2013-12-29
 Re: Long Range Thread 17.0
dkodgis wrote:Between the circle and oval there is a rectangle-in the last image you left us with and not the images from last year-and I see the blue above that rectangle. Is that the Modoki showing up? I hear Modoki and I associate the word “centered”.
I added some labels to the image your referring. See the image below then refer back to our current SSA above.
http://www.jamstec.go.jp/frcgc/research/d1/iod/enmodoki_home_s.html.en
_________________
"In weather and in life, there's no winning and losing; there's only winning and learning."
WINTER 2012/2013 TOTALS 43.65"WINTER 2017/2018 TOTALS 62.85" WINTER 2022/2023 TOTALS 4.9"
WINTER 2013/2014 TOTALS 64.85"WINTER 2018/2019 TOTALS 14.25" WINTER 2023/2024 TOTALS 13.1"
WINTER 2014/2015 TOTALS 71.20"WINTER 2019/2020 TOTALS 6.35"
WINTER 2015/2016 TOTALS 35.00"WINTER 2020/2021 TOTALS 37.75"
WINTER 2016/2017 TOTALS 42.25"WINTER 2021/2022 TOTALS 31.65"

sroc4- Admin

- Posts : 8354
Reputation : 302
Join date : 2013-01-07
Location : Wading River, LI
 Re: Long Range Thread 17.0
Great post, Scott!! I was looking into things on my break at work last night, and I think that I might have caught a glimpse of some more substantial pattern change precursors that would set us up for a Week 3 of October to Week 1 of November (give or take a couple days) transitional period into a pattern that might resemble our time-mean winter pattern (wink wink). However, that was based on only about 20 minutes of analysis and I intend to follow up with further details, be they good or bad. I'll let our more knowledgeable posters/leaders gnaw on what I might be getting at for now, as I have to go to my second job, and finish out the home stretch of my 30-hour day aha
rb924119- Meteorologist

- Posts : 6928
Reputation : 194
Join date : 2013-02-06
Age : 32
Location : Greentown, Pa
 Re: Long Range Thread 17.0
As a hint, Scott has already started revealing one piece of the magnificent puzzle, but there are others......
rb924119- Meteorologist

- Posts : 6928
Reputation : 194
Join date : 2013-02-06
Age : 32
Location : Greentown, Pa
 Re: Long Range Thread 17.0
Scott to add one area on your map you left out, bye most excellent post, the warm analogs water in the Gulf of Alaska and AluetIan Islands Westward region, that means a N WPO and EPO. This will help feedback and inject the cold Siberia train through and into our area as in 203-14 and 2014-15 winters
This will also help over the tip raise the heights to help form blocking in the AO and NAO regions.
Just my observations at this time.
Canada is off the charts for snow this September in Alberta province and Hudson Bay is very anamoulously cold, that should freeze by November. The cold and snow in Greenland is extreme as well. This is important to help promote cold as we move forward.he,k even western US mountain regions seeing snows, not rare but a good indication.
Remember that low solar, sunspots, equals low radiance which also means much more cloudiness. This will.promote more precipitation and cooler temps. There is a chart that shows this over the tropical equator region and N of 40N. I have to find this online and share, but it is very iteresti g to see the correlation.
Also, geomagnetic events will continue to be active like EQ and Volcanoe activities. Well just yesterday I read an arricle.on how 4 Supervcanoes - Iceland, Italy, Peru and south pacific were gurgling some the venting type of gurgling images showing magma starting to build. Could be 100 years before anyone of these blow but interesting to see nonetheless in this cyclenof our planet and sAR system.
_________________
Mugs
AKA:King: Snow Weenie
Self Proclaimed
WINTER 2014-15 : 55.12" +.02 for 6 coatings (avg. 35")
WINTER 2015-16 Total - 29.8" (Avg 35")
WINTER 2016-17 : 39.5" so far
amugs- Advanced Forecaster - Mod

- Posts : 15095
Reputation : 213
Join date : 2013-01-07
Age : 54
Location : Hillsdale,NJ
 Re: Long Range Thread 17.0
Out of curiosity, what does Joe Bastardi say about this wintet. I was really impressed with his call on those two cold winters five years ago. If he is on board, I am moving to FL!

dkodgis- Senior Enthusiast

- Posts : 2560
Reputation : 98
Join date : 2013-12-29
 Re: Long Range Thread 17.0
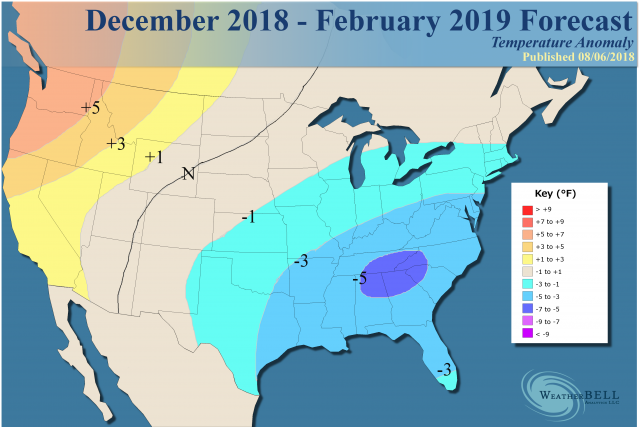
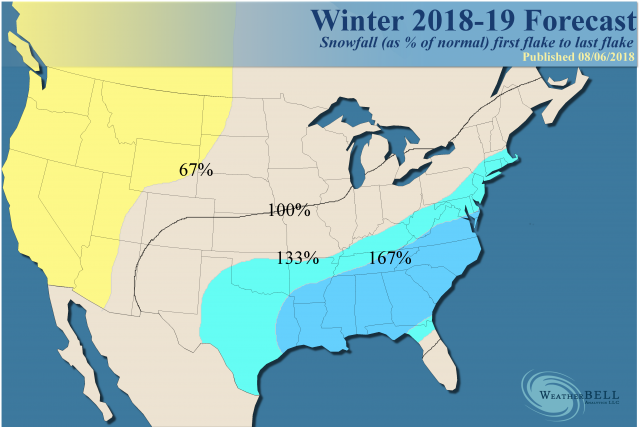
He is saying temp are going to be 1 to 3 BN and Snowfall 133% AN. Start packing LOL!!dkodgis wrote:Out of curiosity, what does Joe Bastardi say about this wintet. I was really impressed with his call on those two cold winters five years ago. If he is on board, I am moving to FL!
_________________
Mugs
AKA:King: Snow Weenie
Self Proclaimed
WINTER 2014-15 : 55.12" +.02 for 6 coatings (avg. 35")
WINTER 2015-16 Total - 29.8" (Avg 35")
WINTER 2016-17 : 39.5" so far

amugs- Advanced Forecaster - Mod

- Posts : 15095
Reputation : 213
Join date : 2013-01-07
Age : 54
Location : Hillsdale,NJ
 Re: Long Range Thread 17.0
amugs wrote:He is saying temp are going to be 1 to 3 BN and Snowfall 133% AN. Start packing LOL!!dkodgis wrote:Out of curiosity, what does Joe Bastardi say about this wintet. I was really impressed with his call on those two cold winters five years ago. If he is on board, I am moving to FL!
LIKE
Grselig- Senior Enthusiast

- Posts : 1408
Reputation : 140
Join date : 2013-03-04
Age : 54
Location : Wayne NJ
 Re: Long Range Thread 17.0
I’m packing just in case. But I like it too

dkodgis- Senior Enthusiast

- Posts : 2560
Reputation : 98
Join date : 2013-12-29
 Re: Long Range Thread 17.0
_________________
Mugs
AKA:King: Snow Weenie
Self Proclaimed
WINTER 2014-15 : 55.12" +.02 for 6 coatings (avg. 35")
WINTER 2015-16 Total - 29.8" (Avg 35")
WINTER 2016-17 : 39.5" so far

amugs- Advanced Forecaster - Mod

- Posts : 15095
Reputation : 213
Join date : 2013-01-07
Age : 54
Location : Hillsdale,NJ

Quietace- Meteorologist - Mod

- Posts : 3689
Reputation : 33
Join date : 2013-01-07
Age : 27
Location : Point Pleasant, NJ
 Re: Long Range Thread 17.0
_________________
"In weather and in life, there's no winning and losing; there's only winning and learning."
WINTER 2012/2013 TOTALS 43.65"WINTER 2017/2018 TOTALS 62.85" WINTER 2022/2023 TOTALS 4.9"
WINTER 2013/2014 TOTALS 64.85"WINTER 2018/2019 TOTALS 14.25" WINTER 2023/2024 TOTALS 13.1"
WINTER 2014/2015 TOTALS 71.20"WINTER 2019/2020 TOTALS 6.35"
WINTER 2015/2016 TOTALS 35.00"WINTER 2020/2021 TOTALS 37.75"
WINTER 2016/2017 TOTALS 42.25"WINTER 2021/2022 TOTALS 31.65"

sroc4- Admin

- Posts : 8354
Reputation : 302
Join date : 2013-01-07
Location : Wading River, LI
 Re: Long Range Thread 17.0
On my phone, I thought the JB maps posted by Mugs showed a 1 to 3 degree departure from the average temp. Looking at it on full screen, I see it is predicted actual temp. OK I may stay around for those temps. Why pay high property and school taxes in NY if not for the change of seasons.

dkodgis- Senior Enthusiast

- Posts : 2560
Reputation : 98
Join date : 2013-12-29
 Re: Long Range Thread 17.0
Well, If if I take a look at this again, it still says that this is a map forecasting the percent of normal snowfall from first to last flake for this winter. So if I once again do the mental math, well it still adds up...
So no, I do not think I am reading into this too deep, in fact, I am taking this quite literally. I am not disagreeing many forcings are going to be very favorable this winter for the east coast if you enjoy cold and snow; but rather the faulty communication in this map.

Quietace- Meteorologist - Mod

- Posts : 3689
Reputation : 33
Join date : 2013-01-07
Age : 27
Location : Point Pleasant, NJ
 Re: Long Range Thread 17.0
Quietace wrote:Well, If if I take a look at this again, it still says that this is a map forecasting the percent of normal snowfall from first to last flake for this winter. So if I once again do the mental math, well it still adds up...
So no, I do not think I am reading into this too deep, in fact, I am taking this quite literally. I am not disagreeing many forcings are going to be very favorable this winter for the east coast if you enjoy cold and snow; but rather the faulty communication in this map.
So if you have a specific backyard that avgs 0.0 but you think this year that location might actually see 1/2-1” how do you propose you forecast that with this sort of lead time? Or let’s say the same location which avgs 0.0” per year and also never even sees snow but you think there is a chance that it snows but never sticks how do you propose you forecast that with this lead time.
Maybe your not but it appears from my vantage point you may be reading into a little too deep given the lead time.
_________________
"In weather and in life, there's no winning and losing; there's only winning and learning."
WINTER 2012/2013 TOTALS 43.65"WINTER 2017/2018 TOTALS 62.85" WINTER 2022/2023 TOTALS 4.9"
WINTER 2013/2014 TOTALS 64.85"WINTER 2018/2019 TOTALS 14.25" WINTER 2023/2024 TOTALS 13.1"
WINTER 2014/2015 TOTALS 71.20"WINTER 2019/2020 TOTALS 6.35"
WINTER 2015/2016 TOTALS 35.00"WINTER 2020/2021 TOTALS 37.75"
WINTER 2016/2017 TOTALS 42.25"WINTER 2021/2022 TOTALS 31.65"

sroc4- Admin

- Posts : 8354
Reputation : 302
Join date : 2013-01-07
Location : Wading River, LI
 Re: Long Range Thread 17.0
Quietace wrote:Well, If if I take a look at this again, it still says that this is a map forecasting the percent of normal snowfall from first to last flake for this winter. So if I once again do the mental math, well it still adds up...
So no, I do not think I am reading into this too deep, in fact, I am taking this quite literally. I am not disagreeing many forcings are going to be very favorable this winter for the east coast if you enjoy cold and snow; but rather the faulty communication in this map.
Honestly, I think this is a petty discussion, BUT, to play Devil's Advocate here I offer the following:
If you think about this statistically, it's a valid forecast. Using Tallahassee, the statistical bell curve is centered on 0.0". Now, obviously, you can't have less than 0.0", so we are only looking at the positive side of the curve. No matter how steep the tail, there is still a statistical tail to snowfall events. As such, even though 100% of "normal" in this case is 0.0", he is stating that this season's annual snowfall will be 67% greater than "normal". Mathematically, no, you can't make that work you have clearly stated. However, statistically, it is sensical as he is also forecasting a 67% chance of receiving above-average snowfall. Now, if you account for a 67% shift to the right of the statistical bell curve, you are shifting the curve by exactly 1-sigma (fun fact), but as a result of this shift, you can now extract the expected snowfall amount by overlaying this new shifted bell curve over the original statistical bell curve, which willntherefore be a non-zero amount.
rb924119- Meteorologist

- Posts : 6928
Reputation : 194
Join date : 2013-02-06
Age : 32
Location : Greentown, Pa
 Re: Long Range Thread 17.0
I tell you one thing with the way the Pacific is looking along with other factors seemingly in our favor, you can move that 167% into our neck of the woods. Looking forward to many late nights of model tracking.rb924119 wrote:Quietace wrote:Well, If if I take a look at this again, it still says that this is a map forecasting the percent of normal snowfall from first to last flake for this winter. So if I once again do the mental math, well it still adds up...
So no, I do not think I am reading into this too deep, in fact, I am taking this quite literally. I am not disagreeing many forcings are going to be very favorable this winter for the east coast if you enjoy cold and snow; but rather the faulty communication in this map.
Honestly, I think this is a petty discussion, BUT, to play Devil's Advocate here I offer the following:
If you think about this statistically, it's a valid forecast. Using Tallahassee, the statistical bell curve is centered on 0.0". Now, obviously, you can't have less than 0.0", so we are only looking at the positive side of the curve. No matter how steep the tail, there is still a statistical tail to snowfall events. As such, even though 100% of "normal" in this case is 0.0", he is stating that this season's annual snowfall will be 67% greater than "normal". Mathematically, no, you can't make that work you have clearly stated. However, statistically, it is sensical as he is also forecasting a 67% chance of receiving above-average snowfall. Now, if you account for a 67% shift to the right of the statistical bell curve, you are shifting the curve by exactly 1-sigma (fun fact), but as a result of this shift, you can now extract the expected snowfall amount by overlaying this new shifted bell curve over the original statistical bell curve, which willntherefore be a non-zero amount.

nutleyblizzard- Senior Enthusiast

- Posts : 1954
Reputation : 41
Join date : 2014-01-30
Age : 58
Location : Nutley, new jersey
 Re: Long Range Thread 17.0
And snowblowing tje driveway, too

dkodgis- Senior Enthusiast

- Posts : 2560
Reputation : 98
Join date : 2013-12-29
 Re: Long Range Thread 17.0
nutleyblizzard wrote:I tell you one thing with the way the Pacific is looking along with other factors seemingly in our favor, you can move that 167% into our neck of the woods. Looking forward to many late nights of model tracking.rb924119 wrote:Quietace wrote:Well, If if I take a look at this again, it still says that this is a map forecasting the percent of normal snowfall from first to last flake for this winter. So if I once again do the mental math, well it still adds up...
So no, I do not think I am reading into this too deep, in fact, I am taking this quite literally. I am not disagreeing many forcings are going to be very favorable this winter for the east coast if you enjoy cold and snow; but rather the faulty communication in this map.
Honestly, I think this is a petty discussion, BUT, to play Devil's Advocate here I offer the following:
If you think about this statistically, it's a valid forecast. Using Tallahassee, the statistical bell curve is centered on 0.0". Now, obviously, you can't have less than 0.0", so we are only looking at the positive side of the curve. No matter how steep the tail, there is still a statistical tail to snowfall events. As such, even though 100% of "normal" in this case is 0.0", he is stating that this season's annual snowfall will be 67% greater than "normal". Mathematically, no, you can't make that work you have clearly stated. However, statistically, it is sensical as he is also forecasting a 67% chance of receiving above-average snowfall. Now, if you account for a 67% shift to the right of the statistical bell curve, you are shifting the curve by exactly 1-sigma (fun fact), but as a result of this shift, you can now extract the expected snowfall amount by overlaying this new shifted bell curve over the original statistical bell curve, which willntherefore be a non-zero amount.
Disagree (right now). Niño 1.2 is significantly warmer than either 3.4 or 4 right now, which, if remained the case through the winter, correlates to the eastern ridging fighting back. We want the Pacific to look like it did a couple weeks ago where it was clearly warmer in the central tropical Pacific. That said, there are caveats. For one, the entire Niño signal remains meager, so even if this configuration held it would not be overpowering. Two, it would tend to support MJO convection that remains essentially Phase-locked in phases that favor eastern U.S. troughing, which could help to combat the pure Niño signal (again, IF this all held verbatim to how it is now). However, the MJO would need amplitude, as the Niño signal is larger, and therefore carries more weight. There are, of course, other factors that I cannot discuss at present. In looking just at the factors discussed, though, this setup would likely be one of transience biased warm for our region (verbatim), in my opinion.
rb924119- Meteorologist

- Posts : 6928
Reputation : 194
Join date : 2013-02-06
Age : 32
Location : Greentown, Pa
 Re: Long Range Thread 17.0
RB I would not put much credence with Nino 1.2 currently being warmer than 3.4. 1.2 has a known bias of being volatile with surface temps in a week to week basis. There is subsurface warmth in 3.4 that will influence that region in the coming days and weeks. Also there is no model guidance suggesting an eastern Nino developing this fall and winter. I do agree regardless of what happens this Nino will most likely be a weak one which will make other weather parameters come to the fore front. The warm blob in the northern Pacific will promote ridging out west which will ensure a trough in the east. Things look to line up in the Atlantic as well as we have a favorable QBO along with a solar minimum which both will help promote a -NAO and -AO. The only fly in the ointment is a stubborn western Atlantic ridge that remains persistently strong. All in all I'm very confident of an upcoming cold and snowy winter.

nutleyblizzard- Senior Enthusiast

- Posts : 1954
Reputation : 41
Join date : 2014-01-30
Age : 58
Location : Nutley, new jersey
 Re: Long Range Thread 17.0
Thanks for the disco. While this is a "petty" disco on effective communication, I ran the numbers to prove you are in fact correct but doesn't take away from my original point. The final 1-sigma value is .3717 inches, the mean through the recorded history is .0738 inches. Thus, I am forecasted to receive a rather large sum of snowfall this winter.rb924119 wrote:Quietace wrote:Well, If if I take a look at this again, it still says that this is a map forecasting the percent of normal snowfall from first to last flake for this winter. So if I once again do the mental math, well it still adds up...
So no, I do not think I am reading into this too deep, in fact, I am taking this quite literally. I am not disagreeing many forcings are going to be very favorable this winter for the east coast if you enjoy cold and snow; but rather the faulty communication in this map.
Honestly, I think this is a petty discussion, BUT, to play Devil's Advocate here I offer the following:
If you think about this statistically, it's a valid forecast. Using Tallahassee, the statistical bell curve is centered on 0.0". Now, obviously, you can't have less than 0.0", so we are only looking at the positive side of the curve. No matter how steep the tail, there is still a statistical tail to snowfall events. As such, even though 100% of "normal" in this case is 0.0", he is stating that this season's annual snowfall will be 67% greater than "normal". Mathematically, no, you can't make that work you have clearly stated. However, statistically, it is sensical as he is also forecasting a 67% chance of receiving above-average snowfall. Now, if you account for a 67% shift to the right of the statistical bell curve, you are shifting the curve by exactly 1-sigma (fun fact), but as a result of this shift, you can now extract the expected snowfall amount by overlaying this new shifted bell curve over the original statistical bell curve, which willntherefore be a non-zero amount.

Quietace- Meteorologist - Mod

- Posts : 3689
Reputation : 33
Join date : 2013-01-07
Age : 27
Location : Point Pleasant, NJ
 Re: Long Range Thread 17.0
Frank_Wx wrote:Piggy-backing off my posts above the models continue to show what would be a blast of fall-like temps into the area late September into early October. The -EPO/+PNA forces a trough over the east.
GEFS September 29th:
GEFS October 3rd
The EPS are in agreement
It will be interesting to see how long the trough will hold over the east. I think the period between September 28th (+/- 2 days) and October 4th (+/- 2 days) will feature below normal temps. How long it lasts remains to be seen. Most likely, this time of year, it is transient.
Revisiting this post because there are clear signs at this lead time that the cold will not be as pronounced as originally thought.
As Scott mentioned there is a -PNA as opposed to the +PNA models were showing at that time. Here is the same time stamp for the 29th on today's GEFS:

The trough is clearly there in southern Canada but there is no mechanism to drop it south into our region. The warm SSTA's in the Atlantic this time of year will give the SE Ridge or WAR more power than any early-reason trough that tries to come this way.
The GEFS and EPS suggest we'll remain above normal temperatures through the first week of October.

Honestly not a whole lot happening weather-wise in the long range.
_________________
_______________________________________________________________________________________________________
CLICK HERE to view NJ Strong Snowstorm Classifications
 Re: Long Range Thread 17.0
In general by what approx date is the first frost? I have a selfish reason. I want to get rid of crab grass.

dkodgis- Senior Enthusiast

- Posts : 2560
Reputation : 98
Join date : 2013-12-29
 Re: Long Range Thread 17.0
Michael Ventrice is saying how the Euro will be running 4 times a day soon

Snow88- Senior Enthusiast

- Posts : 2193
Reputation : 4
Join date : 2013-01-09
Age : 35
Location : Brooklyn, NY
Page 2 of 41 •  1, 2, 3 ... 21 ... 41
Page 2 of 41
Permissions in this forum:
You cannot reply to topics in this forum|
|
|

 Home
Home

